
From 88 to 50,899 visitors in ten days: the eclipsi.info numbers
First, what this is
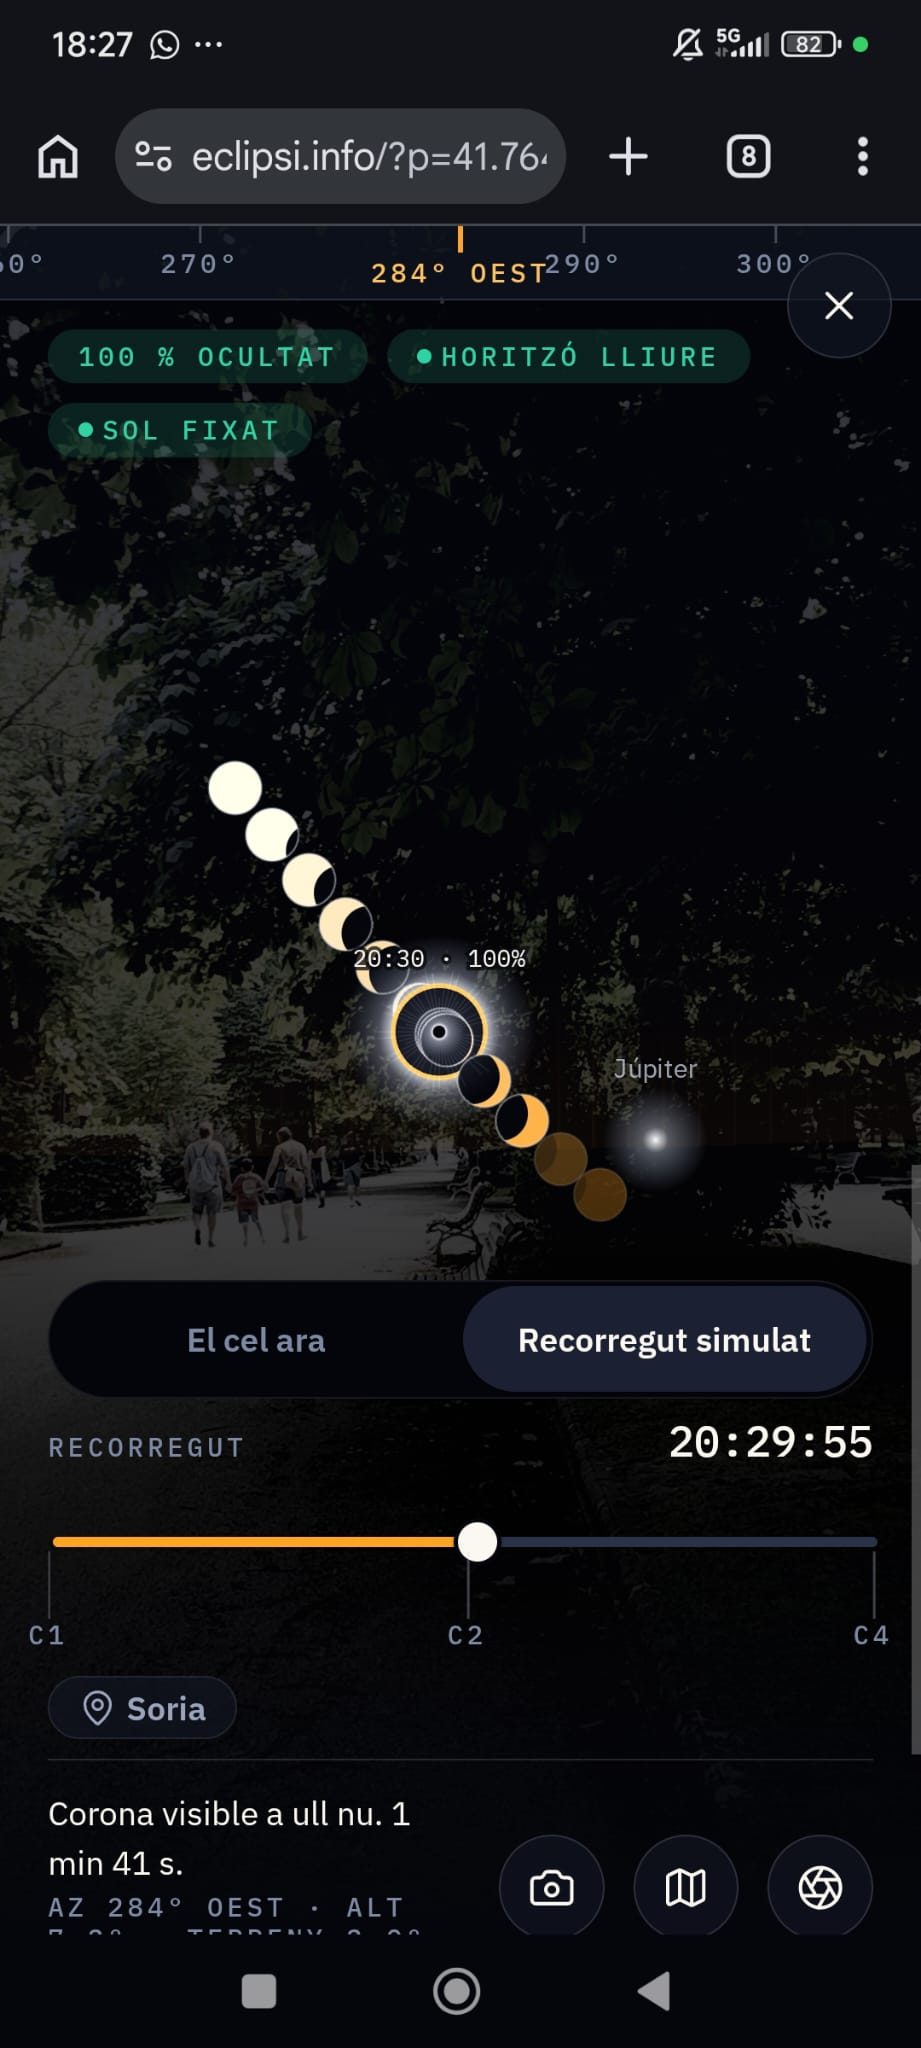
eclipsi.info is a web tool that works out how many seconds of eclipse you will see from your exact spot. Not from your city: from the coordinates and elevation where you will actually stand, with the mountain in front of you factored in.
That mattered because on 12 August 2026 the eclipse arrived with the Sun just a few degrees above the horizon. A totality map tells you where the shadow passes, but not whether a ridge to the west will hide the one moment worth seeing. That was the real question for a lot of people, and nobody was answering it.
Three decisions shaped everything else: the maths runs on your device, so no server ever receives your coordinates and analytics never sees them; it works offline once prepared, which is roughly what mobile coverage looked like inside the path that day; and every figure names its source so you can go and check it. It is free, non-profit, ad-free, account-free, tracking-free and open source: the repository is public and anyone can audit, copy or improve it. There is no business model behind it. There never was.
We put it live on 2 August. It had 88 visitors.
Ten days later, on 12 August, it had 50,899. In a single hour the server handled 570,865 requests. Two hours after that almost nobody was left, because all those people had done exactly what they were supposed to do: put the phone down and look up.
No campaign, no media budget, not a single euro in ads. Just a tool that answered a question nobody else was answering.
The ramp
The growth is not an isolated spike: it is a curve that almost doubles every day from 9 August. Two sources are measuring the same audience with different instruments — Cloudflare at the edge, Google Analytics in the browser — and the gap between them stays remarkably stable.
See the data as a table
| Day | Unique (CF) | Users (GA4) | GA4 coverage | Pages (CF) | Pages (GA4) | Requests |
|---|---|---|---|---|---|---|
| 2 | 88 | — | — | 132 | — | 1,023 |
| 3 | 220 | — | — | 1,512 | — | 6,791 |
| 4 | 12,054 | 2,191 | 18.2 % | 52,195 | 8,180 | 348,240 |
| 5 | 6,798 | 2,012 | 29.6 % | 37,638 | 10,085 | 213,153 |
| 6 | 7,521 | 2,374 | 31.6 % | 42,376 | 12,229 | 246,895 |
| 7 | 8,765 | 3,167 | 36.1 % | 107,934 | 18,191 | 536,589 |
| 8 | 11,272 | 3,637 | 32.3 % | 159,003 | 20,841 | 692,421 |
| 9 | 13,536 | 4,629 | 34.2 % | 171,478 | 26,934 | 756,213 |
| 10 | 18,084 | 5,938 | 32.8 % | 241,686 | 42,875 | 1,000,502 |
| 11 | 26,671 | 8,931 | 33.5 % | 391,199 | 63,730 | 1,546,057 |
| 12 | 50,899 | 16,633 | 32.7 % | 890,866 | 95,711 | 2,975,142 |
| 13 · partial | 3,347 | 540 | 16.1 % | 22,262 | 2,007 | 59,889 |
Look at 4 August: visitors multiply by 55 over the previous day. That is the first wave of press coverage landing. And look at the coverage column in the table: between 5 and 12 August, Analytics only sees 30% to 36% of the visitors Cloudflare sees. The ratio does not move even on the peak day, which says the difference is structural — cookie consent, blockers, bots — not a one-off measurement failure.
In practice: for reach figures, trust the server; for behaviour, trust Analytics. If you only look at Analytics, two thirds of your audience never make it into the report. That is the kind of thing worth knowing before you present results to anyone.
The day
On 12 August the site served 2,975,142 requests. The hourly curve explains audience behaviour better than any total.
See the data as a table
| Hour | Requests |
|---|---|
| 02:00 | 9,784 |
| 03:00 | 3,776 |
| 04:00 | 3,970 |
| 05:00 | 4,635 |
| 06:00 | 11,918 |
| 07:00 | 34,540 |
| 08:00 | 77,449 |
| 09:00 | 106,766 |
| 10:00 | 121,906 |
| 11:00 | 139,783 |
| 12:00 | 144,016 |
| 13:00 | 154,697 |
| 14:00 | 178,118 |
| 15:00 | 205,904 |
| 16:00 | 242,815 |
| 17:00 | 285,719 |
| 18:00 | 420,745 |
| 19:00 | 570,865 |
| 20:00 | 171,640 |
| 21:00 | 29,424 |
| 22:00 | 23,994 |
| 23:00 | 16,713 |
| 00:00 · 13 | 10,273 |
| 01:00 · 13 | 5,692 |
| 02:00 · 13 | 6,261 |
The peak runs 19:00 to 20:00: 570,865 requests in one hour, about 158 per second. The next hour drops to 171,640 and the one after to 29,424 — a 95% collapse in two hours, with the exact same shape in Analytics (6,416 users at 19:00, 3,466 at 20:00). People checked the site until the last second, then left the screen.
The part nobody sees: the server
This is where we get insufferable, because it is the half of the job almost nobody shows. A peak of 158 requests per second takes down plenty of sites that sell themselves as professional. This one did not flinch.
The numbers behind that: 666 server errors across 8.3 million requests, or 0.008%. 95.4% of responses were clean. 94.6% of the data came from cache — 138 GB served — and the origin was barely touched. 99 threats blocked and not a single security incident.
None of that is luck. It is decisions taken beforehand:
Nothing to compute on the server. Because the astronomy runs on the user’s phone, the server never has to think: it just hands over files. A site that builds every page on the fly, with a database behind it, would have needed ten times the machine for the same day.
Everything cacheable, behind a CDN. If the edge serves 94.6% of the bytes, the origin only ever sees the tip of the iceberg. That percentage does not happen by itself: you configure the headers, decide what expires and when, and prove the cache-busting works before the big day, not during it.
And knowing where to look when something breaks. There were 67,054 404 responses over the period, 0.8% of the total. With this much incoming press, one mistyped link in a big outlet gets expensive fast, so it is among the first things we check. It shows up in the data because we look; we do not look because it showed up.
Designing something beautiful that falls over on the day it matters is not building a website. It is building half of one.
This was not a hobby extra: it is one of our services. We build and run the infrastructure behind the sites we make — servers, CDN, caching, backups, certificates, monitoring — precisely so that nobody has to make a phone call on peak day. Here is the rest of what we do.
The clipping: 29 pieces and an expensive lesson
Coverage ended at 29 publications in Catalan, Spanish and French, from Time Out and Ouest-France to local radio, with nine public administrations publishing their official viewing points inside the tool.
| Outlet | Format | Sessions | |
|---|---|---|---|
| Large audience | |||
| Time Out Barcelona · ES | Written | 11,397 | |
| Time Out Barcelona · CA | Written | 4,490 | |
| El Periódico | Written | 713 | |
| Ouest-France | Written | 191 | |
| Cadena SER | Audio | — | no measurable link |
| RAC1 | Audio | — | no measurable link |
| Regional and specialist | |||
| Diari de Tarragona | Written | 900 | |
| Regió7 | Written | 341 | |
| Diari de Barcelona | Written | 2 | |
| MetaData | Written | — | no measurable link |
| La Verdad | Written | — | no measurable link |
| Lleida.com | Written | — | no measurable link |
| La Xarxa | Audio | — | no measurable link |
| Local | |||
| Igualada News | Written | 175 | |
| Ràdio Cambrils | Audio | 25 | |
| Esplugues.digital | Written | 19 | |
| El 3 de Vuit | Written | 16 | |
| Ràdio Sant Andreu | Audio | 13 | |
| Vilapress | Written | — | no measurable link |
| Next Llobregat | Written | — | no measurable link |
| Viu Molins de Rei | Written | — | no measurable link |
| Ràdio Desvern | Audio | — | no measurable link |
| Ràdio Maricel | Audio | — | no measurable link |
| Outside the initial list | |||
| VilaWeb Press page | Written | 166 | |
| dBalears Press page | Written | 96 | |
| La Ciutat Press page | Written | — | no measurable link |
| Diari de Catalunya Press page | Written | — | no measurable link |
| Tarragona21 Analytics only | Written | 25 | |
| Rêves d'Espace Analytics only | Written | 2 | |
| 29 publications | 18,571 | ||
Time Out accounts for 86% of all press clicks: 15,887 sessions out of the 18,571 arriving from news outlets. The piece was bilingual and kept being linked from other eclipse articles, which stretched its life well past publication day.
But look at the other column. Thirteen publications left no attributable click at all. The audio ones — Cadena SER, RAC1, La Xarxa, two local stations — leave no link by definition. For the written ones that are also missing, the likeliest explanation is that the address was quoted as plain text rather than a link: that traffic ends up counted as direct.
| Direct | 41,195 | 40.8 % | |
| Unassigned | 27,027 | 26.7 % | |
| Referral | 18,624 | 18.4 % | |
| Organic social | 7,060 | 7 % | |
| Organic search | 4,405 | 4.4 % | |
| Cross-network | 2,775 | 2.7 % |
67% of sessions have no attributable source: 41,195 direct and 27,027 unassigned out of 101,088. So each outlet’s click count is the floor of its impact, never the ceiling.
And here is the lesson, one of the expensive ones: none of the three sources had the full list. The editorial count had 23 publications. The site’s press page added four that were missing. And analytics turned up two more that appeared nowhere else. Together, 29. Rebuilding that by hand, ten days later, is work that tagged links would have made unnecessary from the first press email.
Who showed up
93% of the audience came from a phone — which makes sense for something you check standing in a field with the Sun going down — and Spain accounts for 91.7% of users. Barcelona (11,796), Madrid (6,450) and Valencia (2,695) lead the cities. The split we find most interesting is by language.
| Catalan | 231,442 | 77.5 % | |
| Spanish | 45,043 | 15.1 % | |
| French | 17,614 | 5.9 % | |
| English | 4,210 | 1.4 % |
Catalan takes 77.5% of pageviews. The French version, which looked marginal, served 17,614 pages off the back of a single Ouest-France piece. Publishing in your audience’s language is not an accessibility checkbox: it is a reach decision, and you can see it in the table.
What we take with us
The Iberian peninsula gets three eclipses in little over two years: 12 August was the first, and 2 August 2027 (totality across the south) and 26 January 2028 (annular) are still to come. These numbers are not the end of a campaign: they are the inventory we arrive at the next two with, product already validated under real load.
If you take one thing from all this, take this: the tool worked because someone asked the right question, and it held because someone had already hit the right keys beforehand. Knowing how to build things that work, and which keys to hit is, quite literally, what we do for a living. Eclipse or no eclipse.
If you want to see how the tool works underneath — the topocentric calculation, the real 360° horizon, why the maths runs on your phone instead of a server — we cover that in this other article. The full case study, with what we built and why, is on the project page. And if what you have on your desk looks anything like this, let us talk.
Sources: Cloudflare GraphQL Analytics (eclipsi.info zone) and Google Analytics 4. Data pulled on 13 August 2026.