Xamfrà
One question at a time.
Why it exists
Cities generate data every day. The problem is that, for whoever has to decide, it is scattered across portals, GIS, intranets and case-management systems from different bodies, each with its own format and date.
We wanted to see what happened if all of it lived in one place, could be asked in plain language and every number said where it came from. No client commissioned it: we built it because we wanted that tool and it did not exist the way we imagined it.
What it is
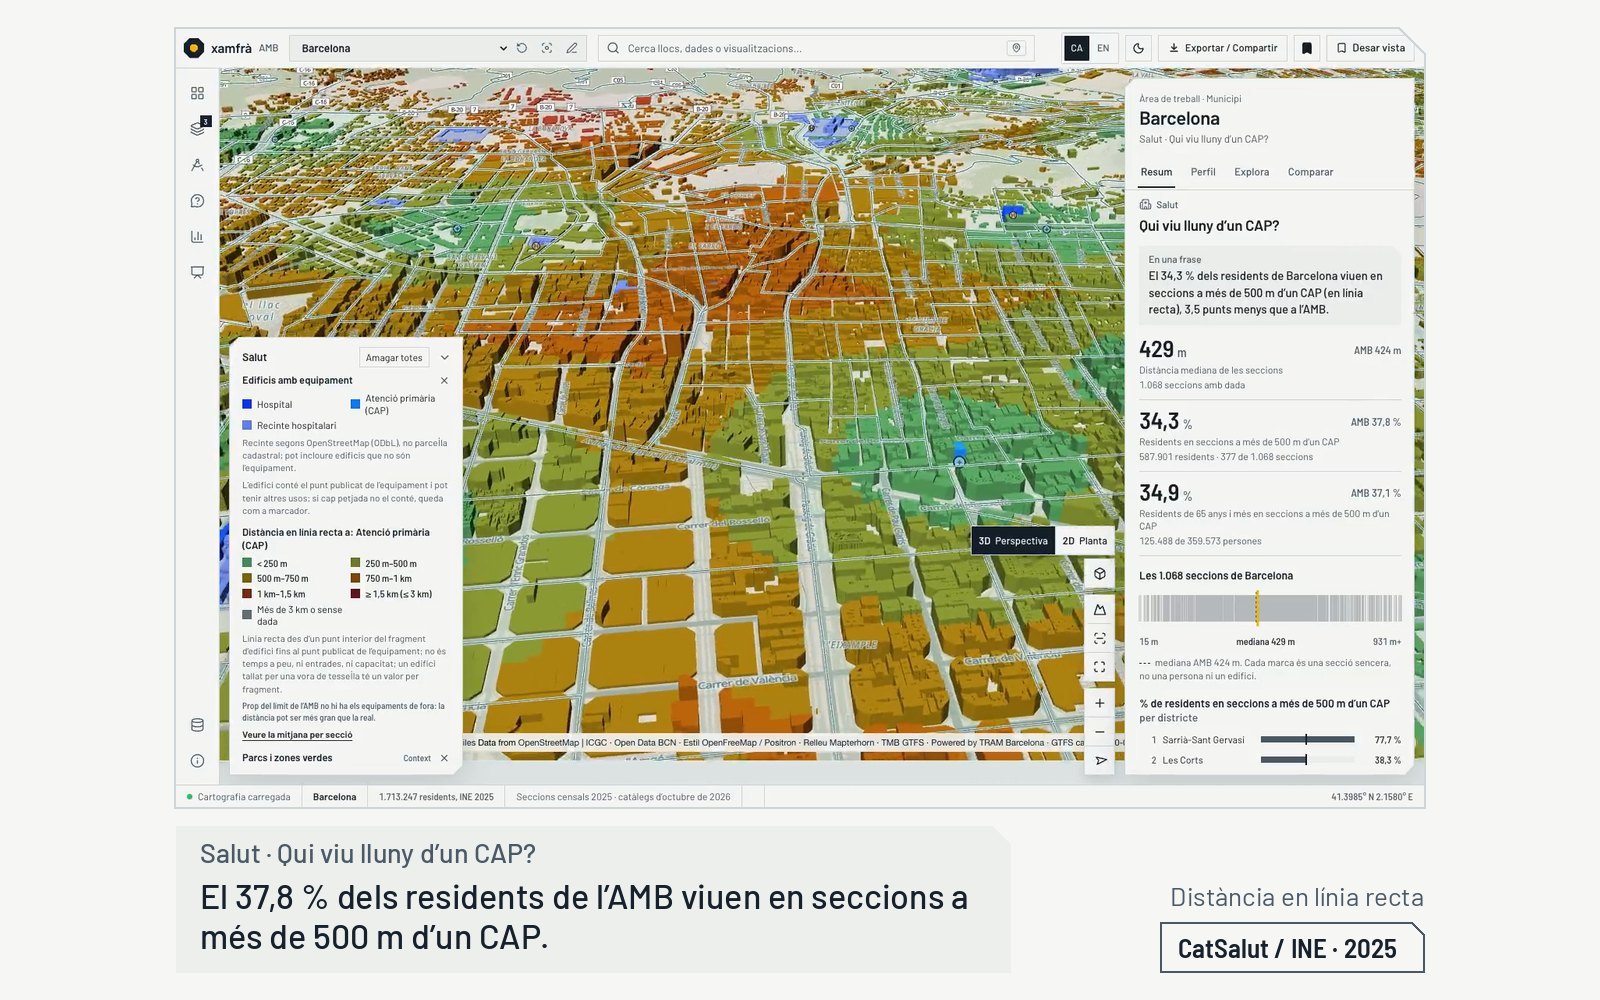
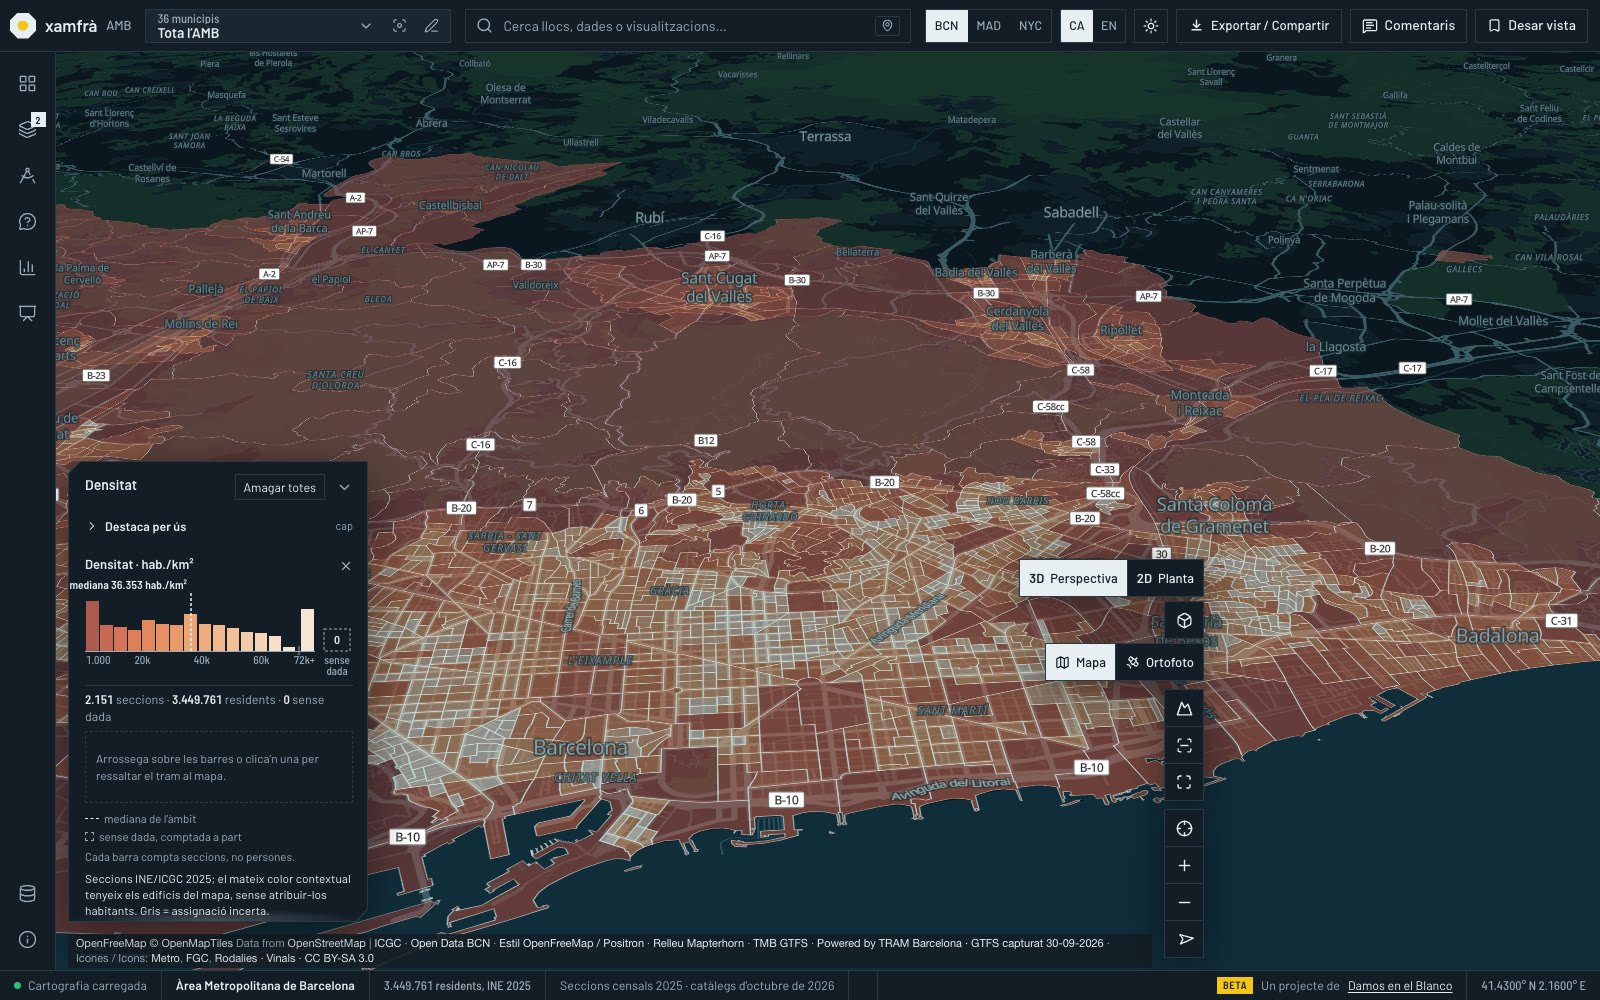
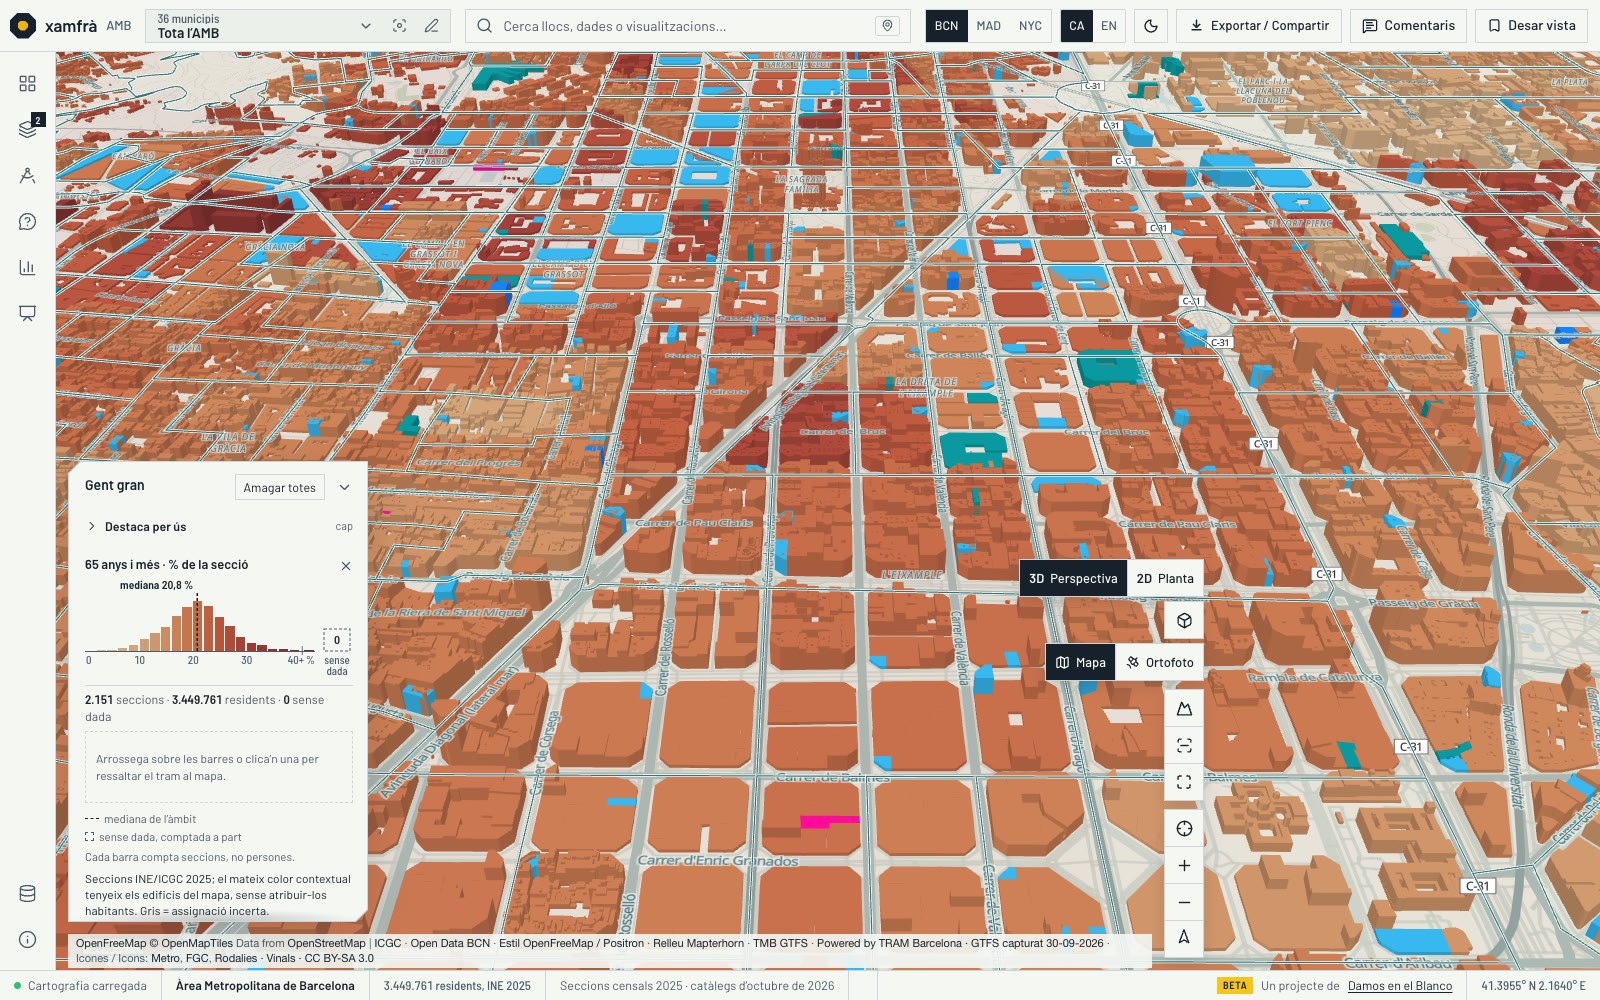
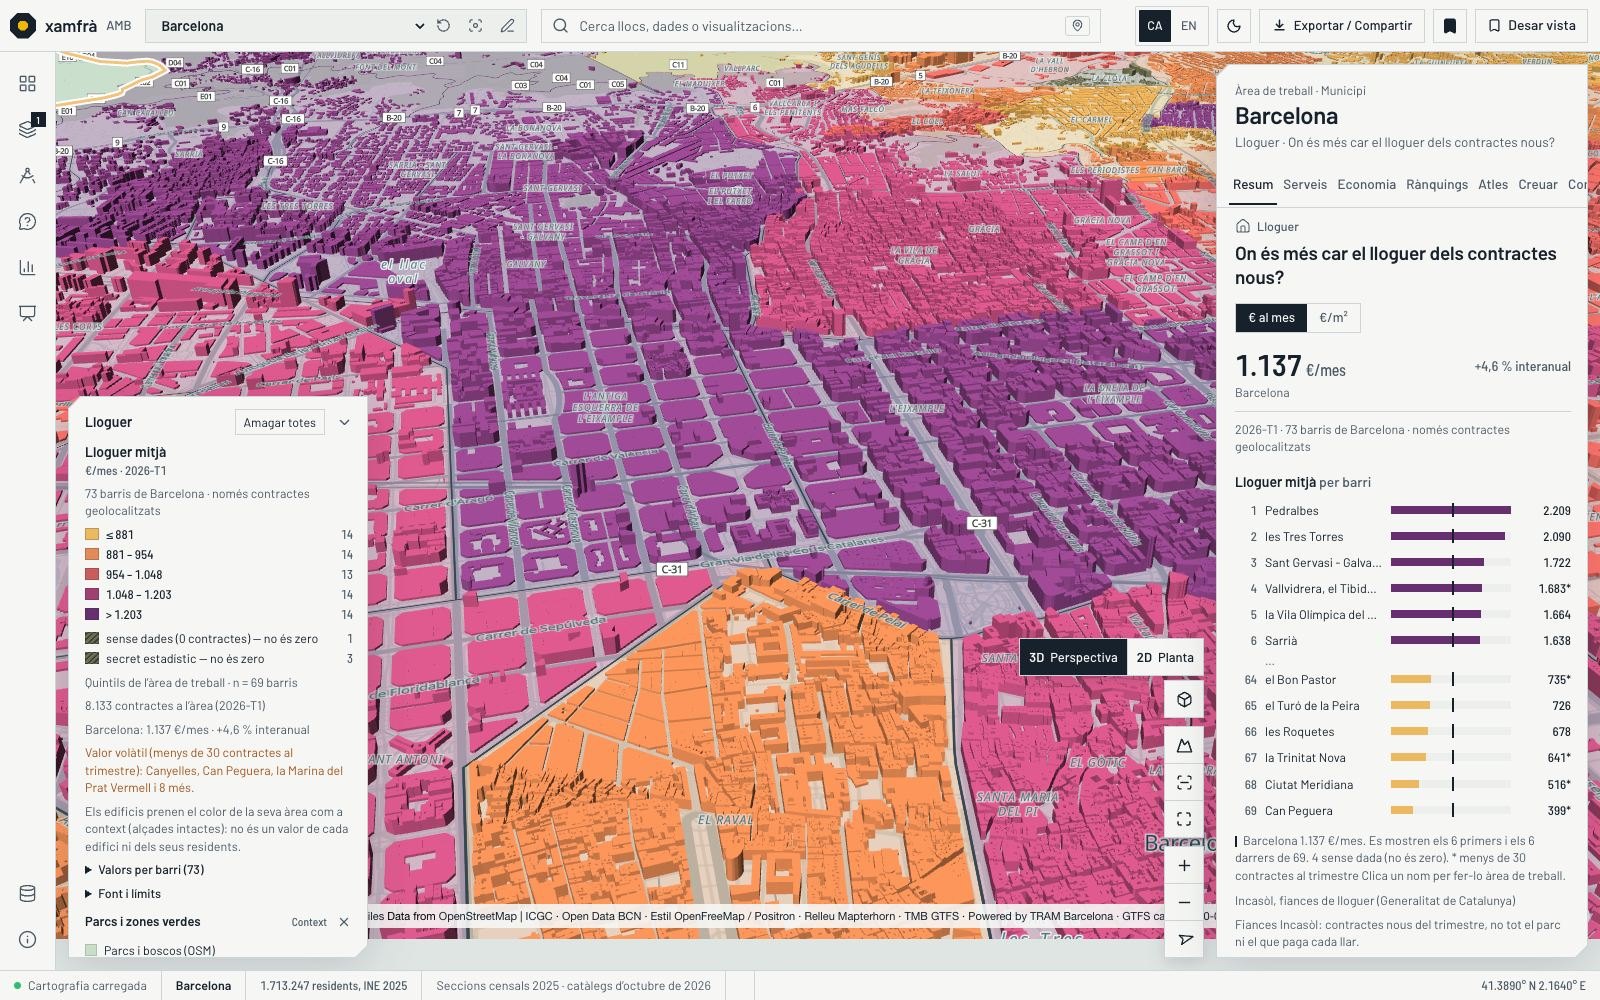
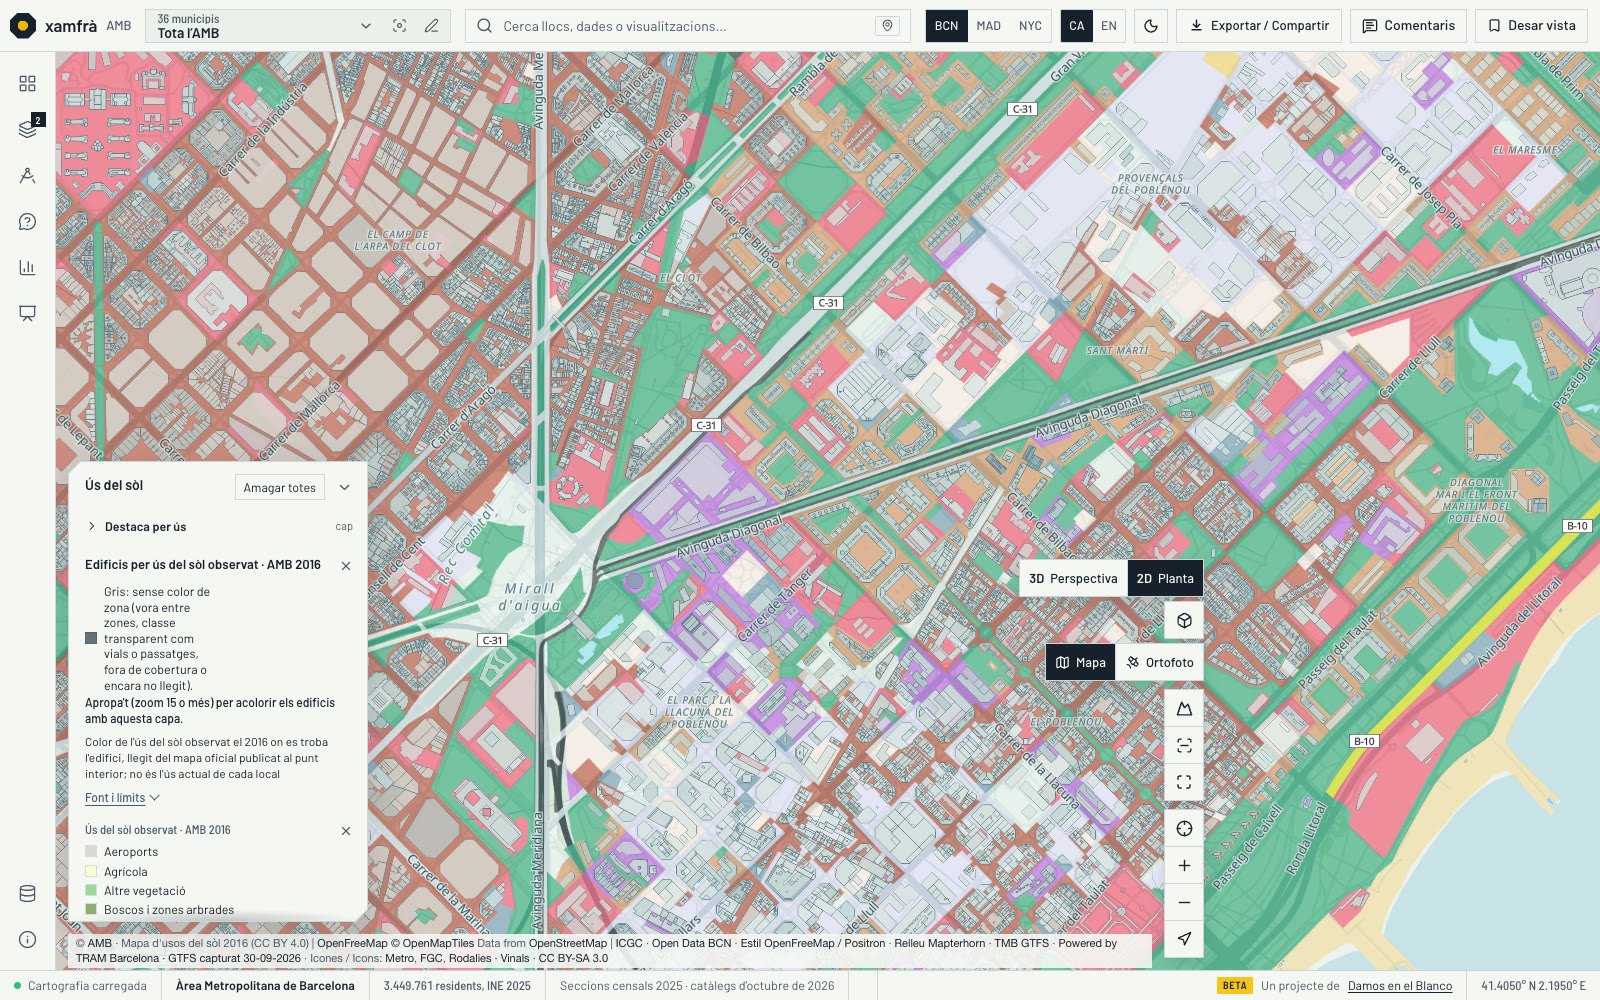
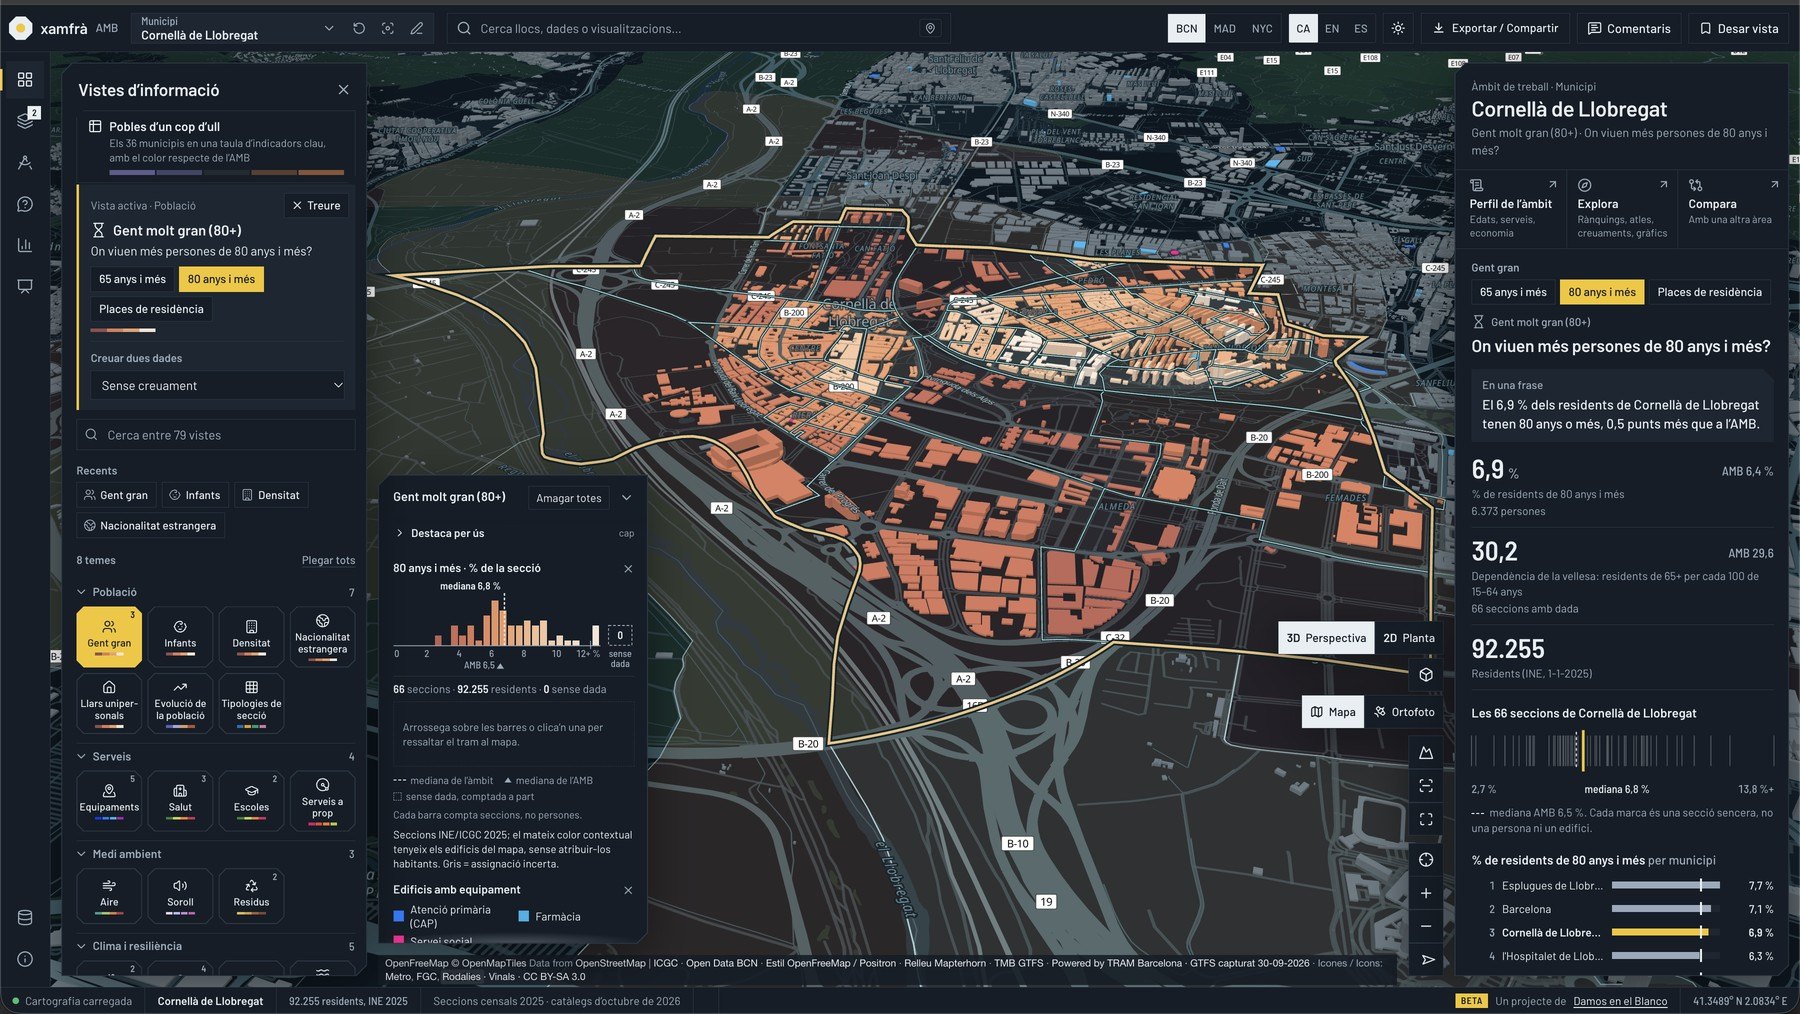
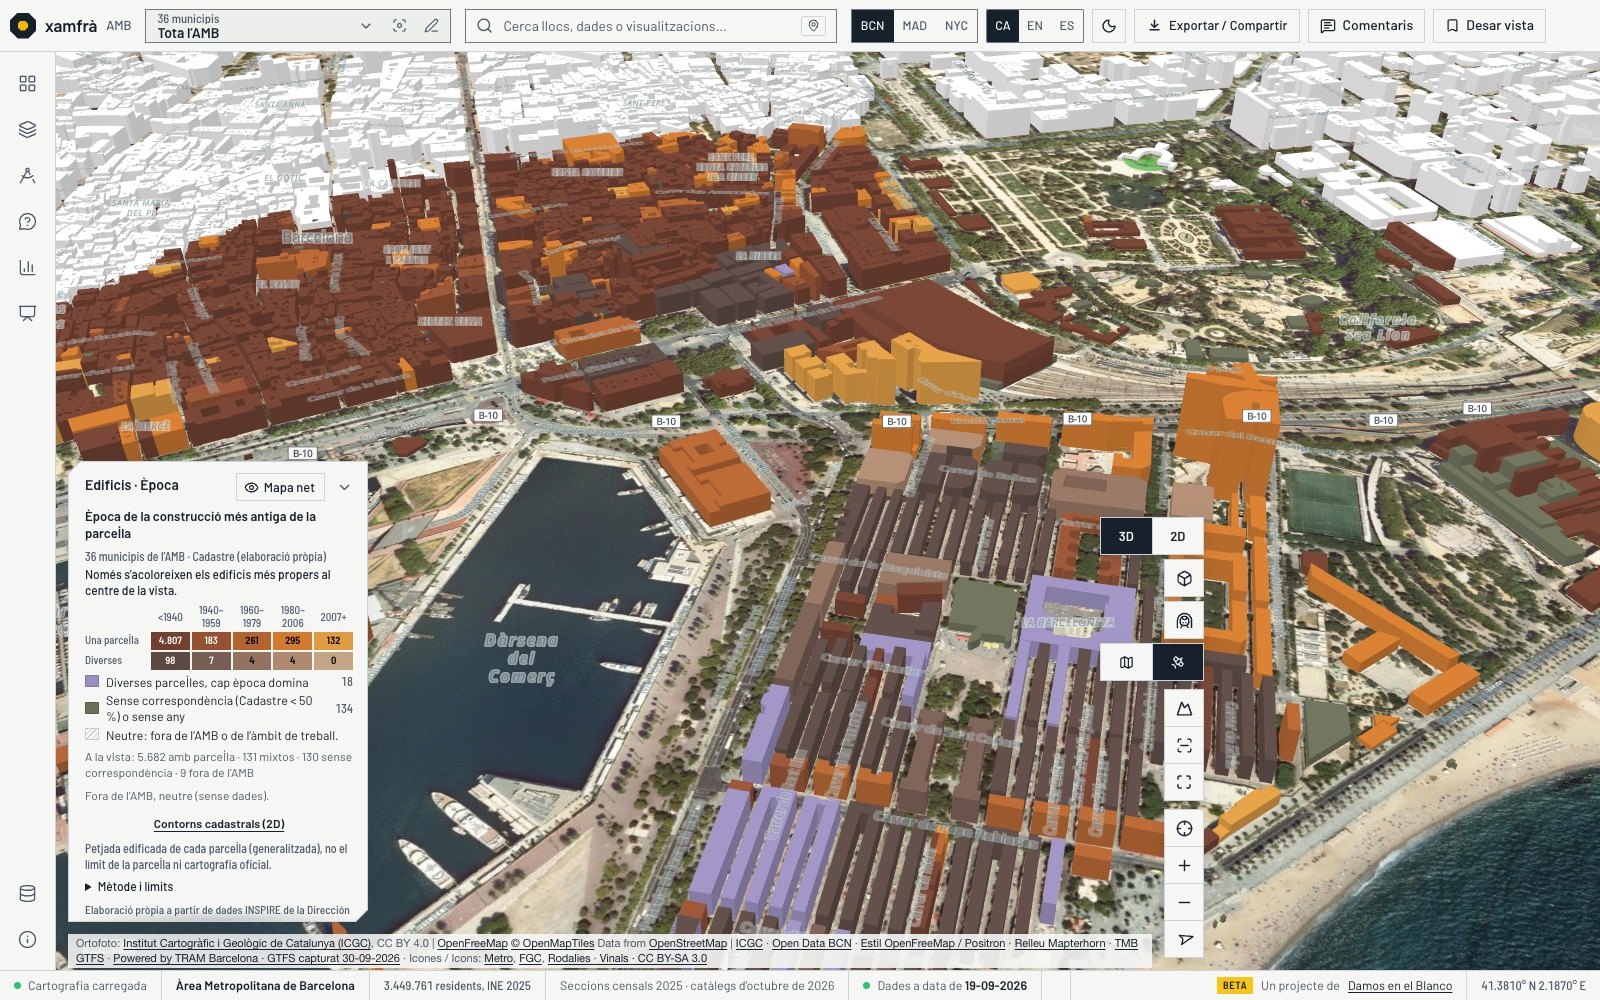
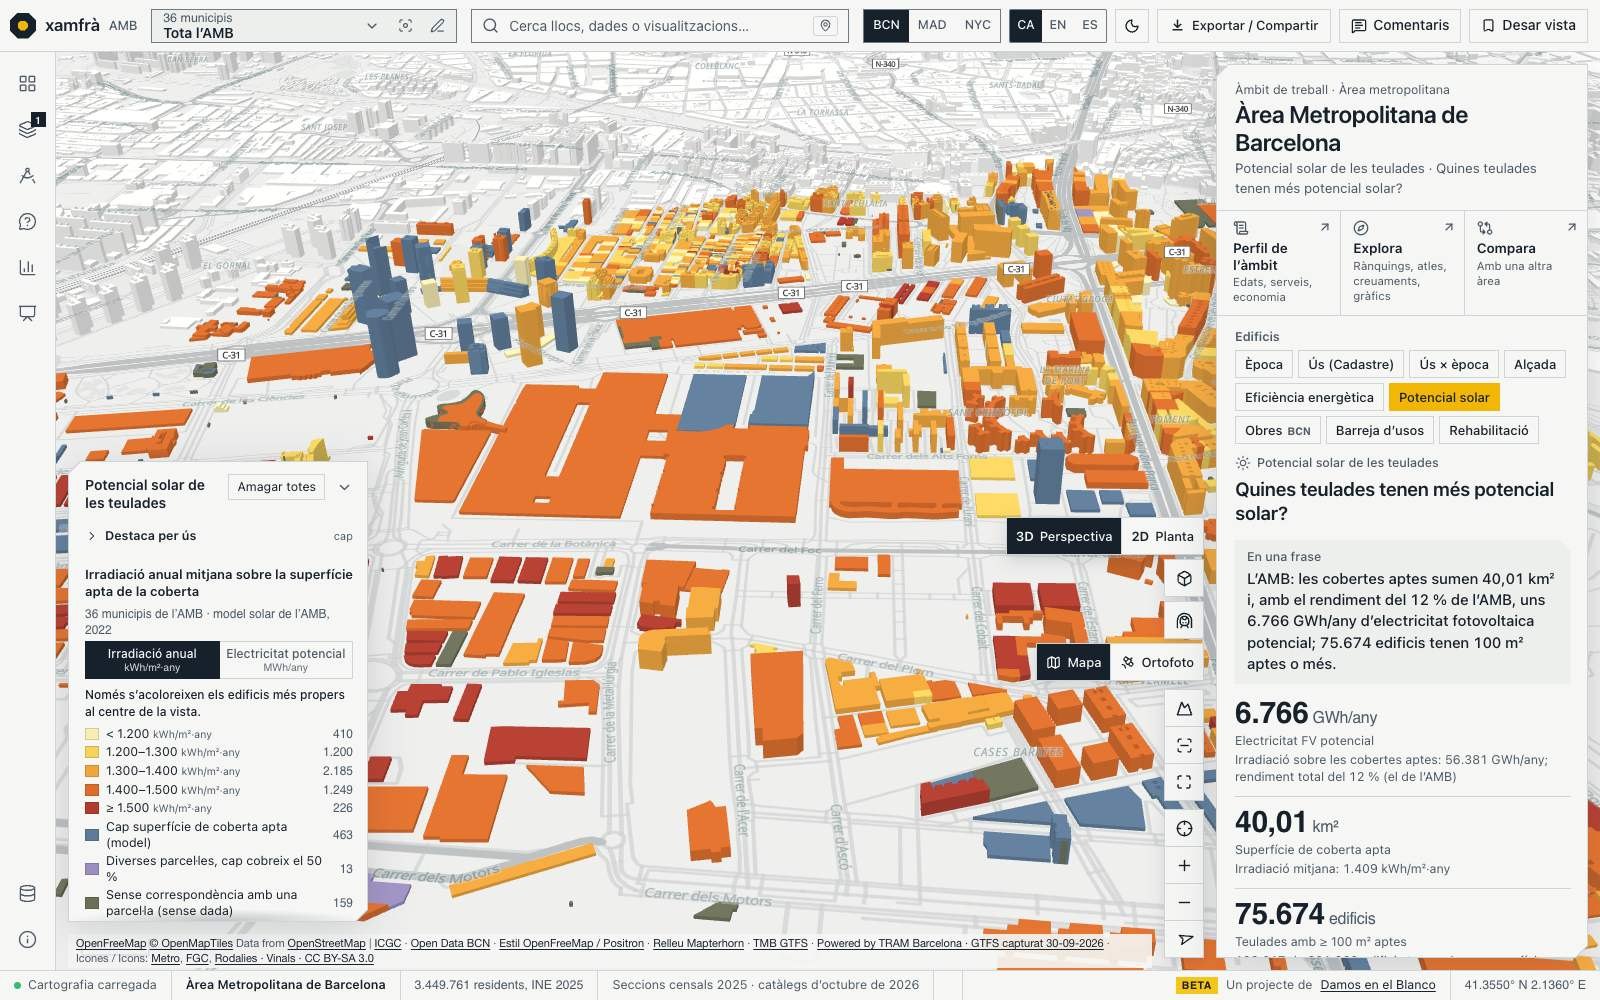
One question at a time. “Who lives far from a health centre?”, “where does the bus run most often?”, “which roofs could produce the most solar energy?”. Each of the 87 views answers a single question, with its legend, its source and its year. You can go from the whole AMB to a municipality, a district, a census section and a building without changing the question.
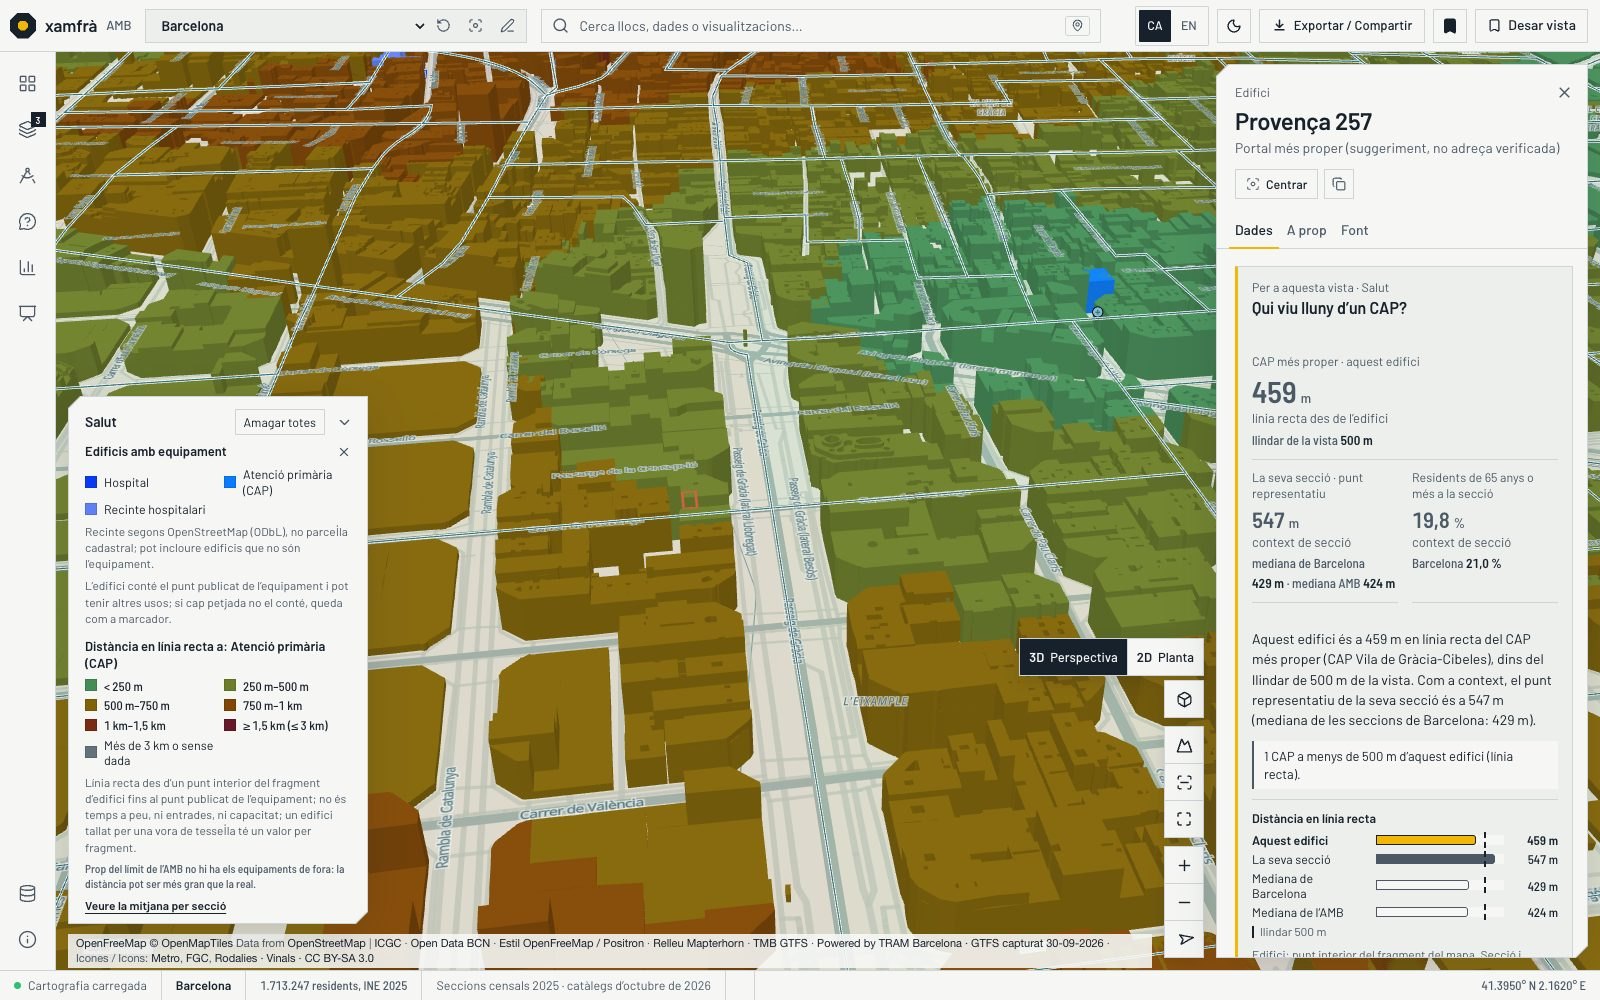
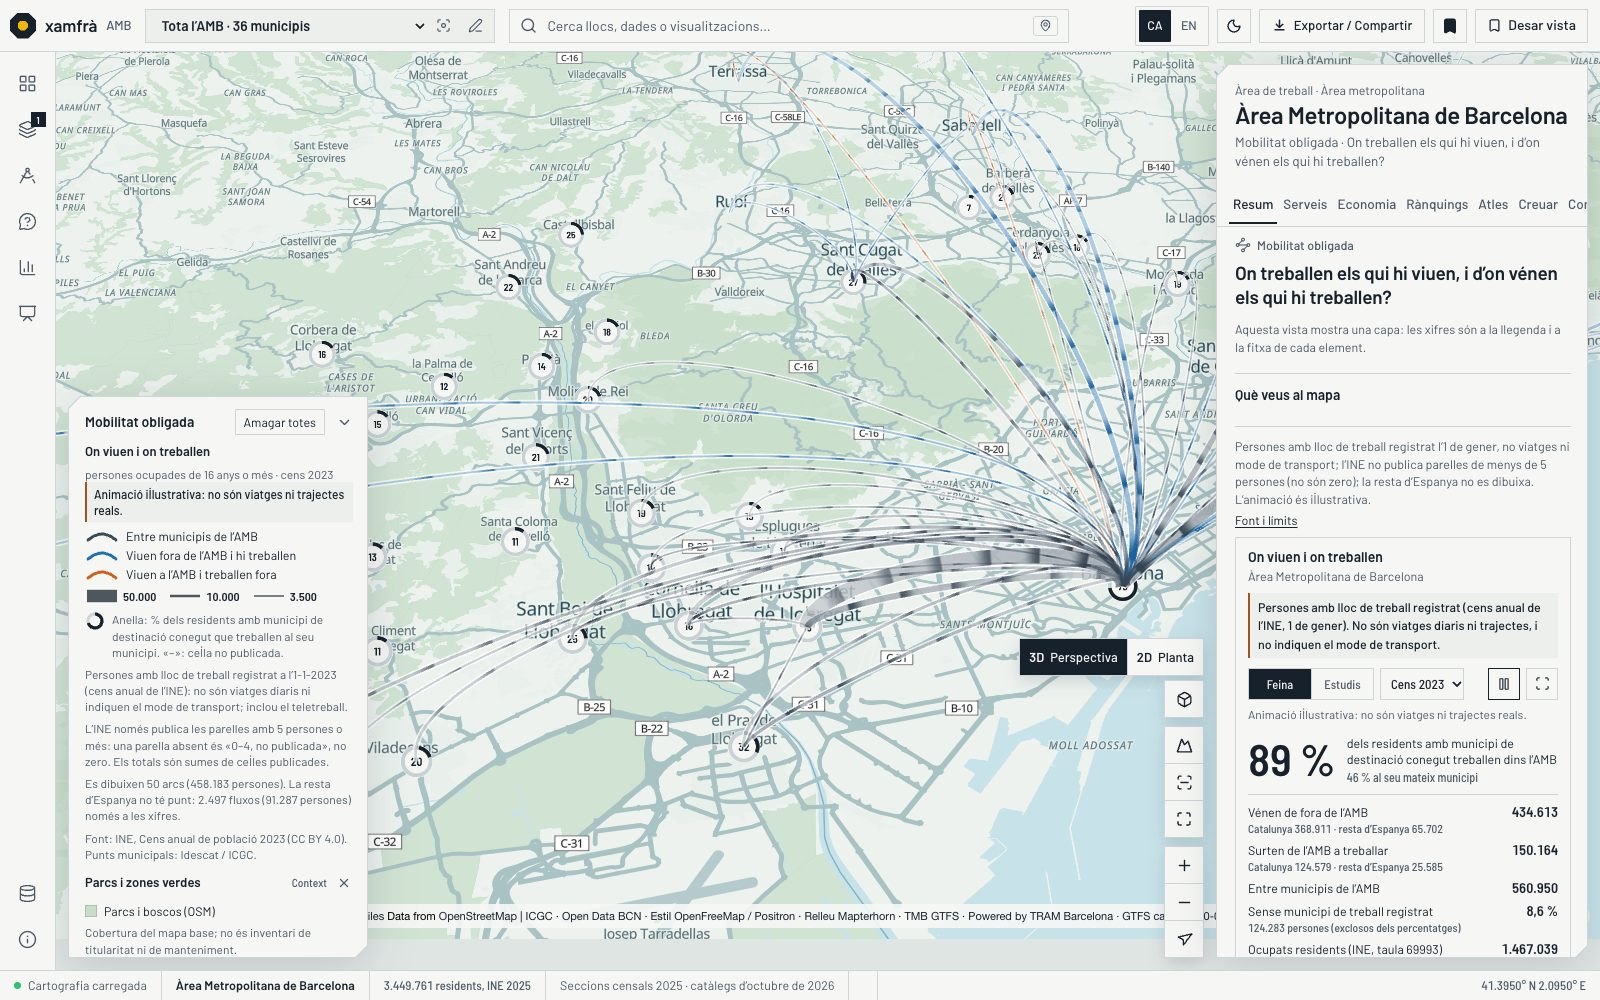
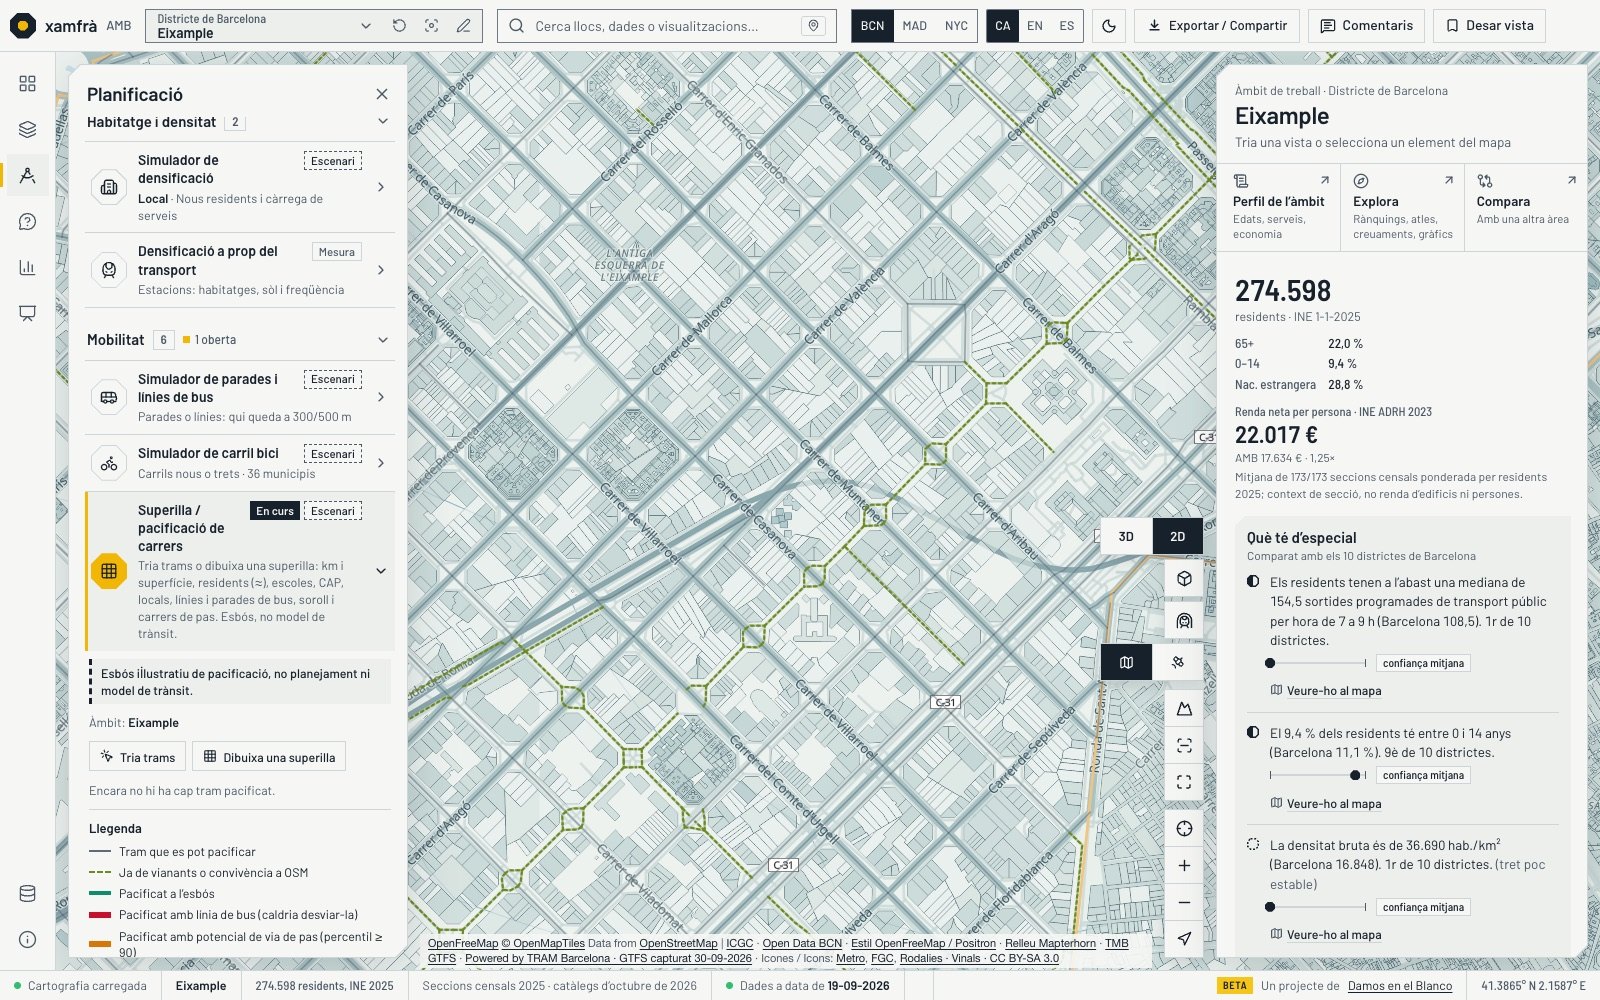
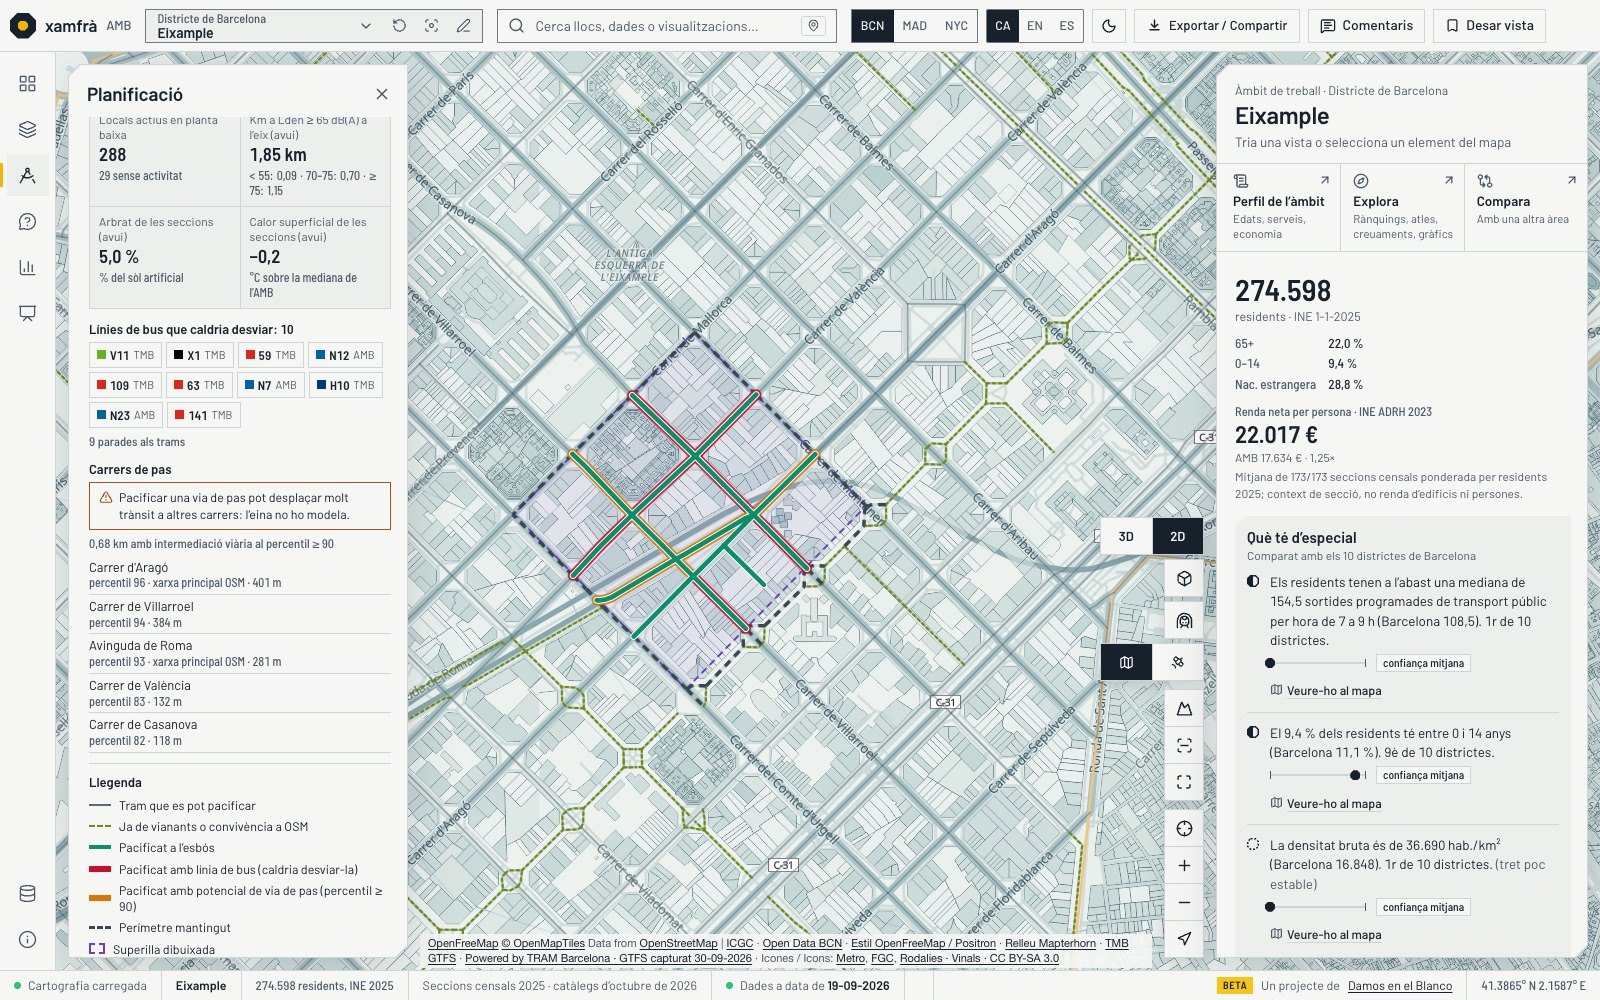
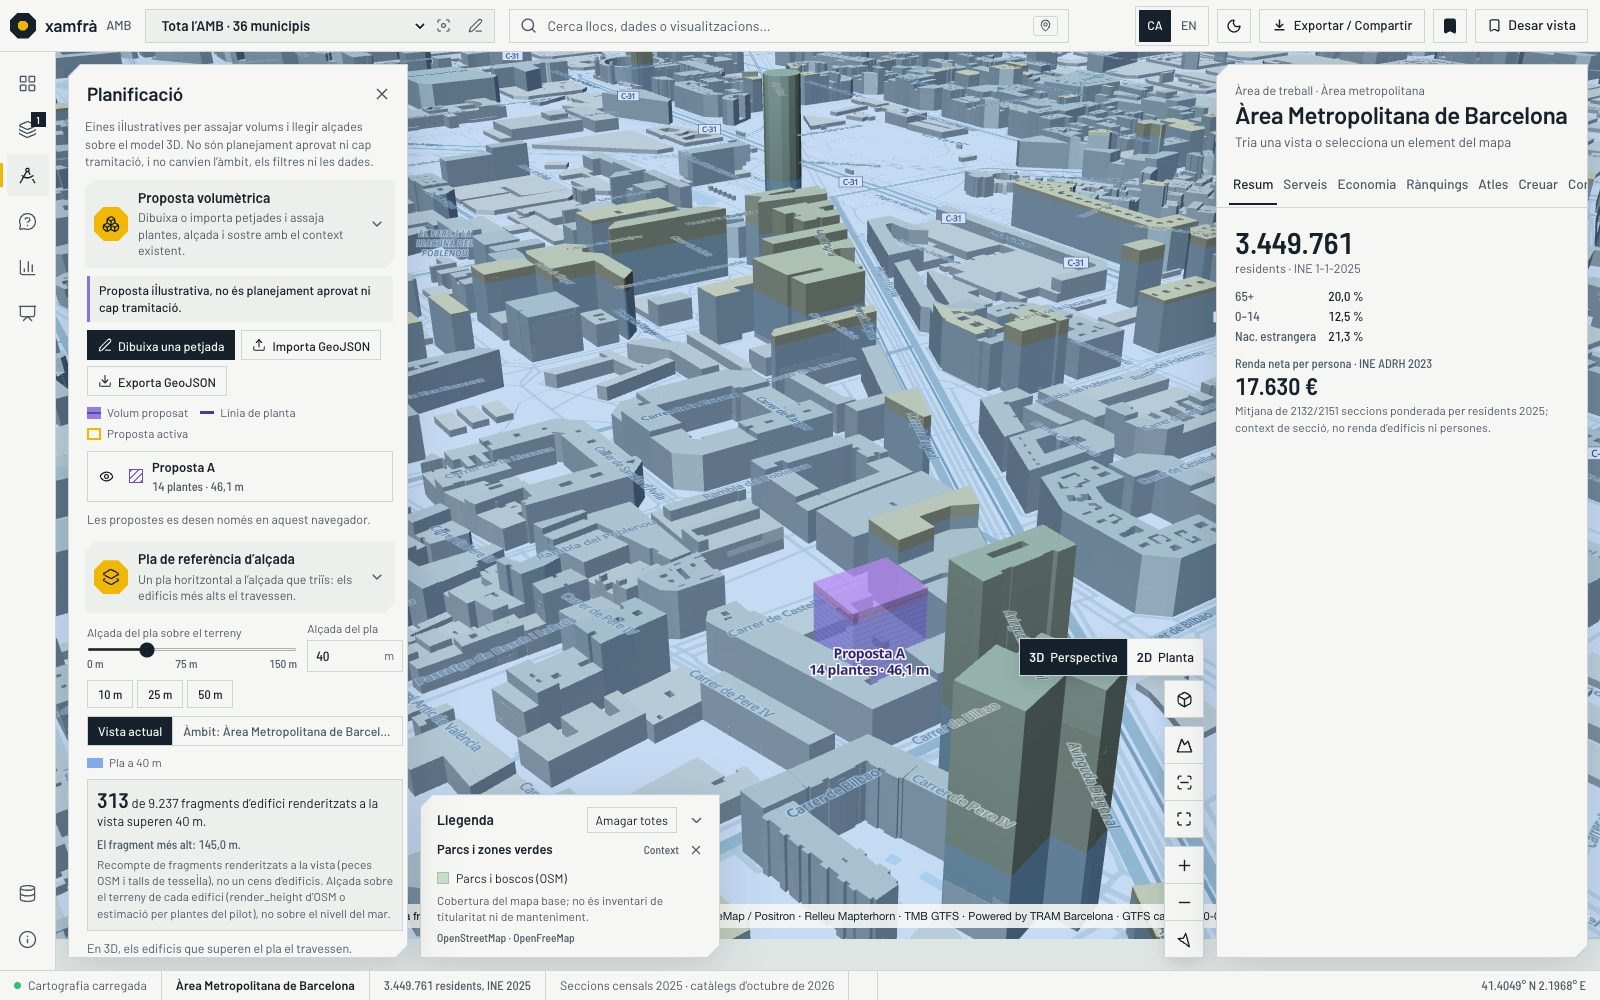
Read, measure, test. Reading means choosing a view and brushing the legend to light up the sections that fall within it. Measuring means hovering over a building, a street or a stop and getting its card: address, walking distance, nearby facilities. Testing means 23 tools — a new facility, a superblock, a new volume — that compare before and after and export to PDF, CSV or JSON.
Figures are never made up. 98 official sources with publisher, period, licence and load date; 2,077 files with their SHA-256 fingerprint. No number is generated by AI, missing data is never painted as zero and a scenario is always labelled as one. The assistant (beta) opens the view and cites the source of every figure.
And a brand that comes from the Eixample. The name comes from Cerdà’s chamfered corner — the xamfrà — and it is the system’s only ornament: two-chamfer panels, octagons, yellow only for what is selected. We also made the landing page, a series of studies with our own method and the promo film in horizontal and vertical.
Every figure says where it comes from.
A digital twin is useless if you cannot trust it. That is why the most important decision was not the 3D: it was making every figure carry its source, its year and its limits, showing the unknown as unknown and making sure a hypothesis can never pass for data. Everything else — the views, the tools, the film — is built on top of that rule.
The project in numbers
Measure or scenario, never both
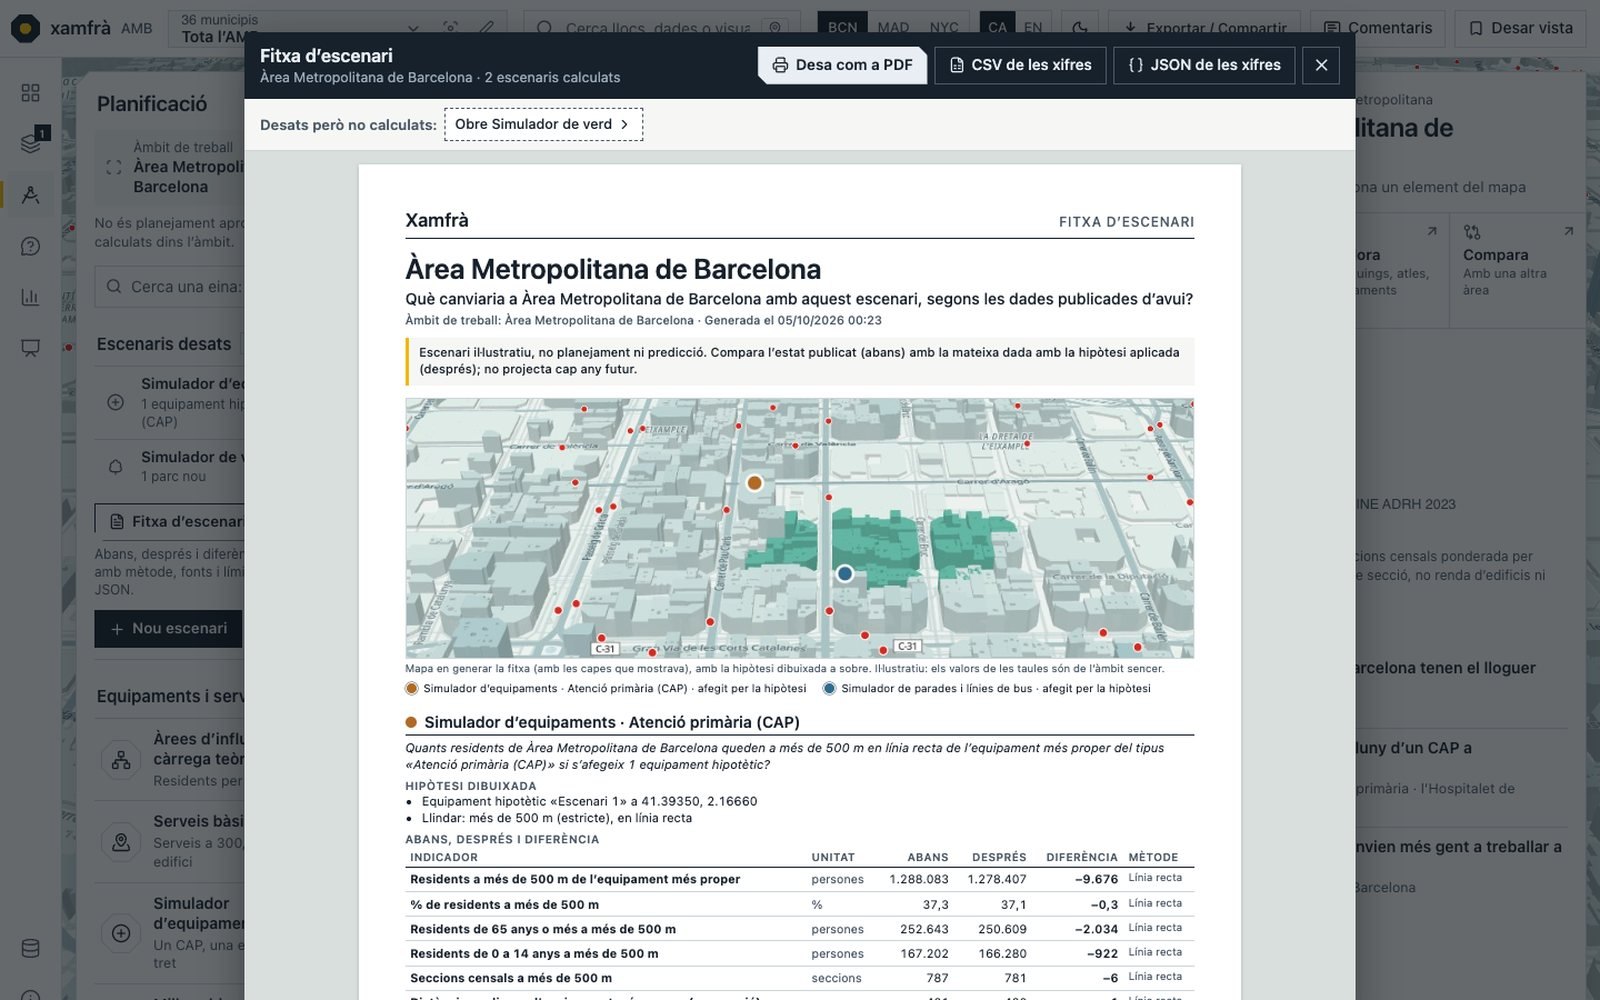
Most viewers mix published data with estimates and leave users to guess. In Xamfrà every tool says what it is: a measure is published data, with a source; a scenario is an illustrative assumption and carries a dashed border. The scenario sheet compares before and after using the same sources and goes into a meeting as a PDF.
The same system already runs as a pilot for the Community of Madrid (179 municipalities) and New York City (5 boroughs): the logic does not depend on the city.
How it went
Gallery · the project in pictures (click to enlarge)
Read
87 views, one question each. From the whole AMB down to a single Eixample block without changing the question.
Measure
A building, a street or a stop gets its own card: address, distances and what is nearby, benchmarked against its section and Barcelona.
Test
23 tools to try out a change. Every scenario is labelled as such and compared with the “before” using the same sources.
Vertical
The social cut, recomposed in 9:16 rather than simply cropped.
"Read the city, measure it and test changes."Xamfrà, in one line
Credits · the people behind it
Want a result like this for your project?