quivoto
Politics starts on your street.
The starting point
A classic voting compass ends with a bold number: you match a party by 82%. It looks objective, but before that percentage someone decided what gets asked, how much each topic weighs and what “in favour” means. In municipal elections, on top of that, party labels explain very little: property tax, housing, a bike lane or the library’s opening hours are decided town by town.
quivoto was built to answer a different question. Not “which party resembles you”, but which candidacy in your municipality thinks like you, based on local evidence and without turning the result into a voting recommendation.
What we built
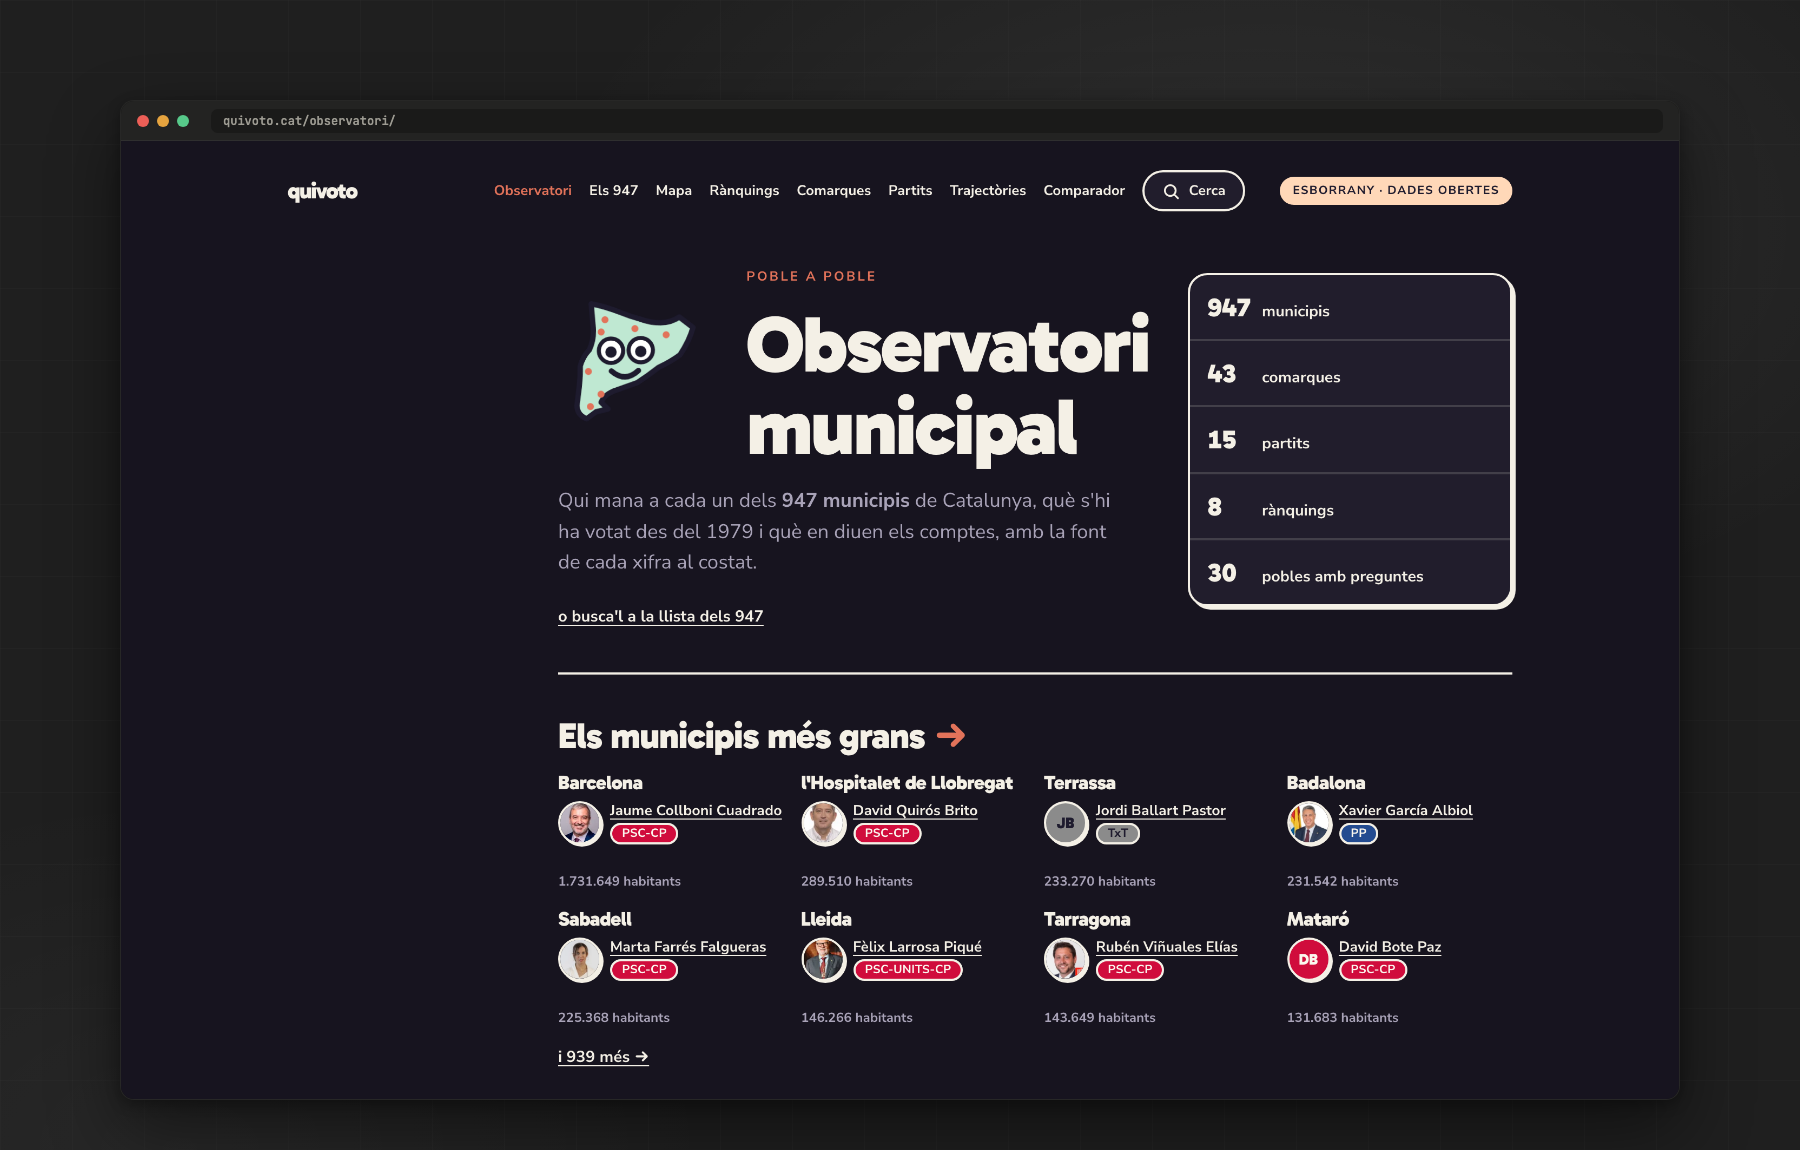
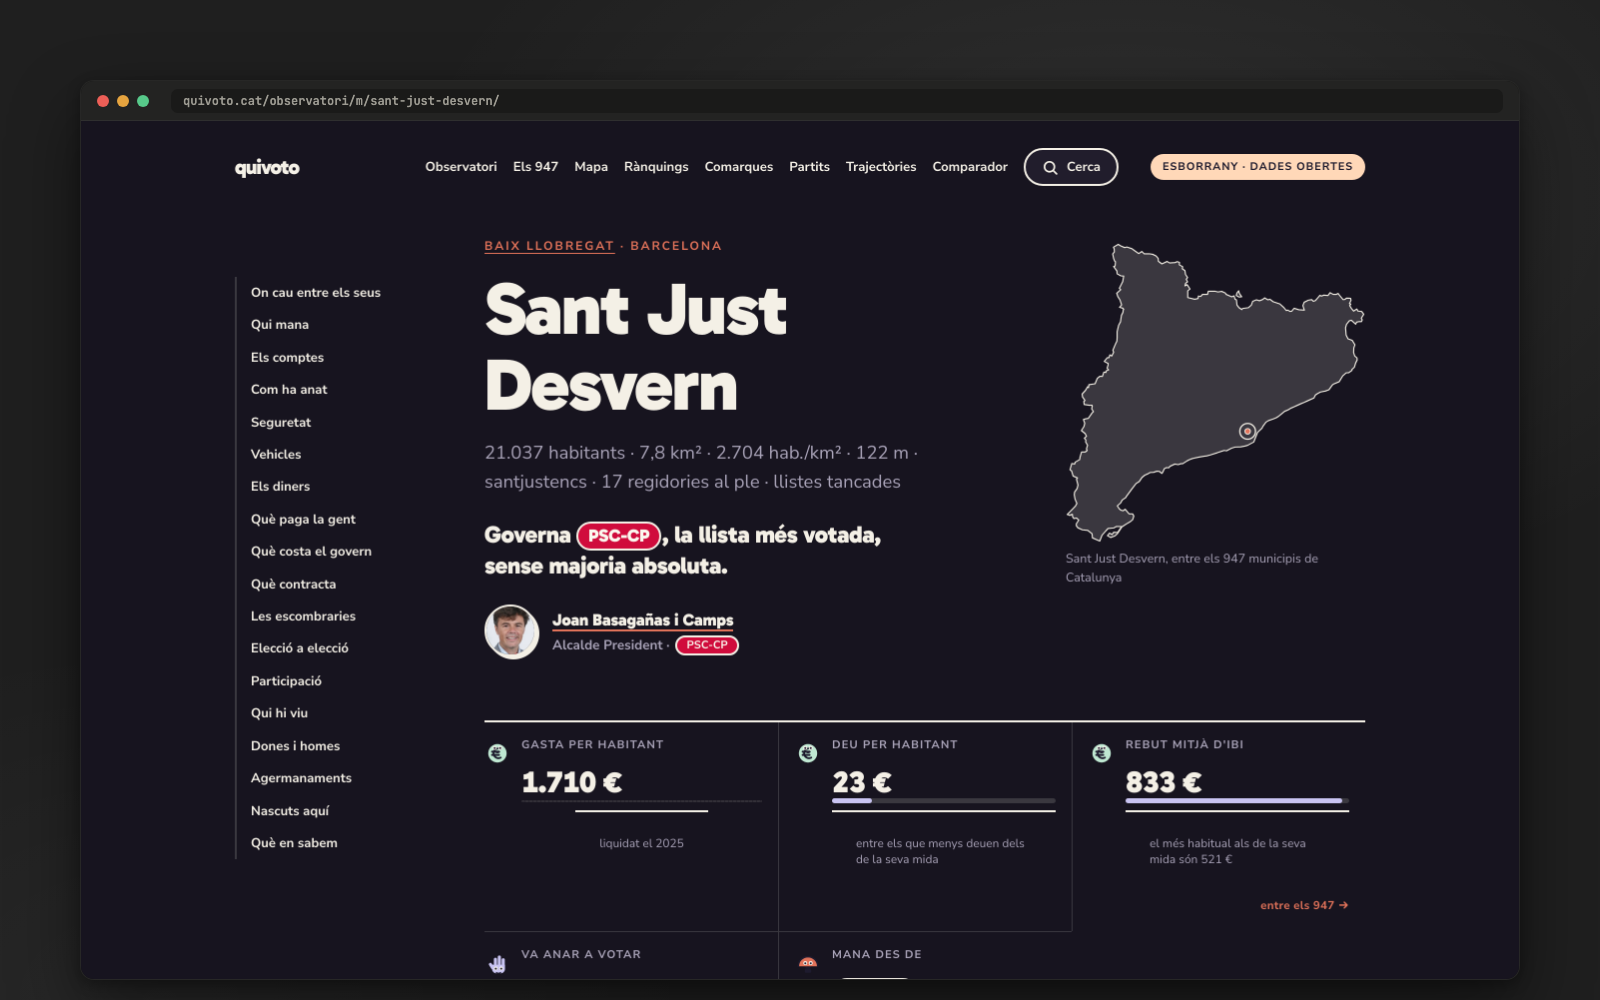
An Observatory before a compass. The 947 municipal profiles gather who governs and with whom, how people have voted since 1979, the full council by name, accounts, debt, taxes and political careers. All measured on the same basis, from a village of 150 to Barcelona.
25 statements per municipality, written from council minutes. Each candidacy’s provisional position comes from actual votes and council agreements, not from a questionnaire nobody answers. And when a group voted against a motion because of how it was worded, the profile says so.
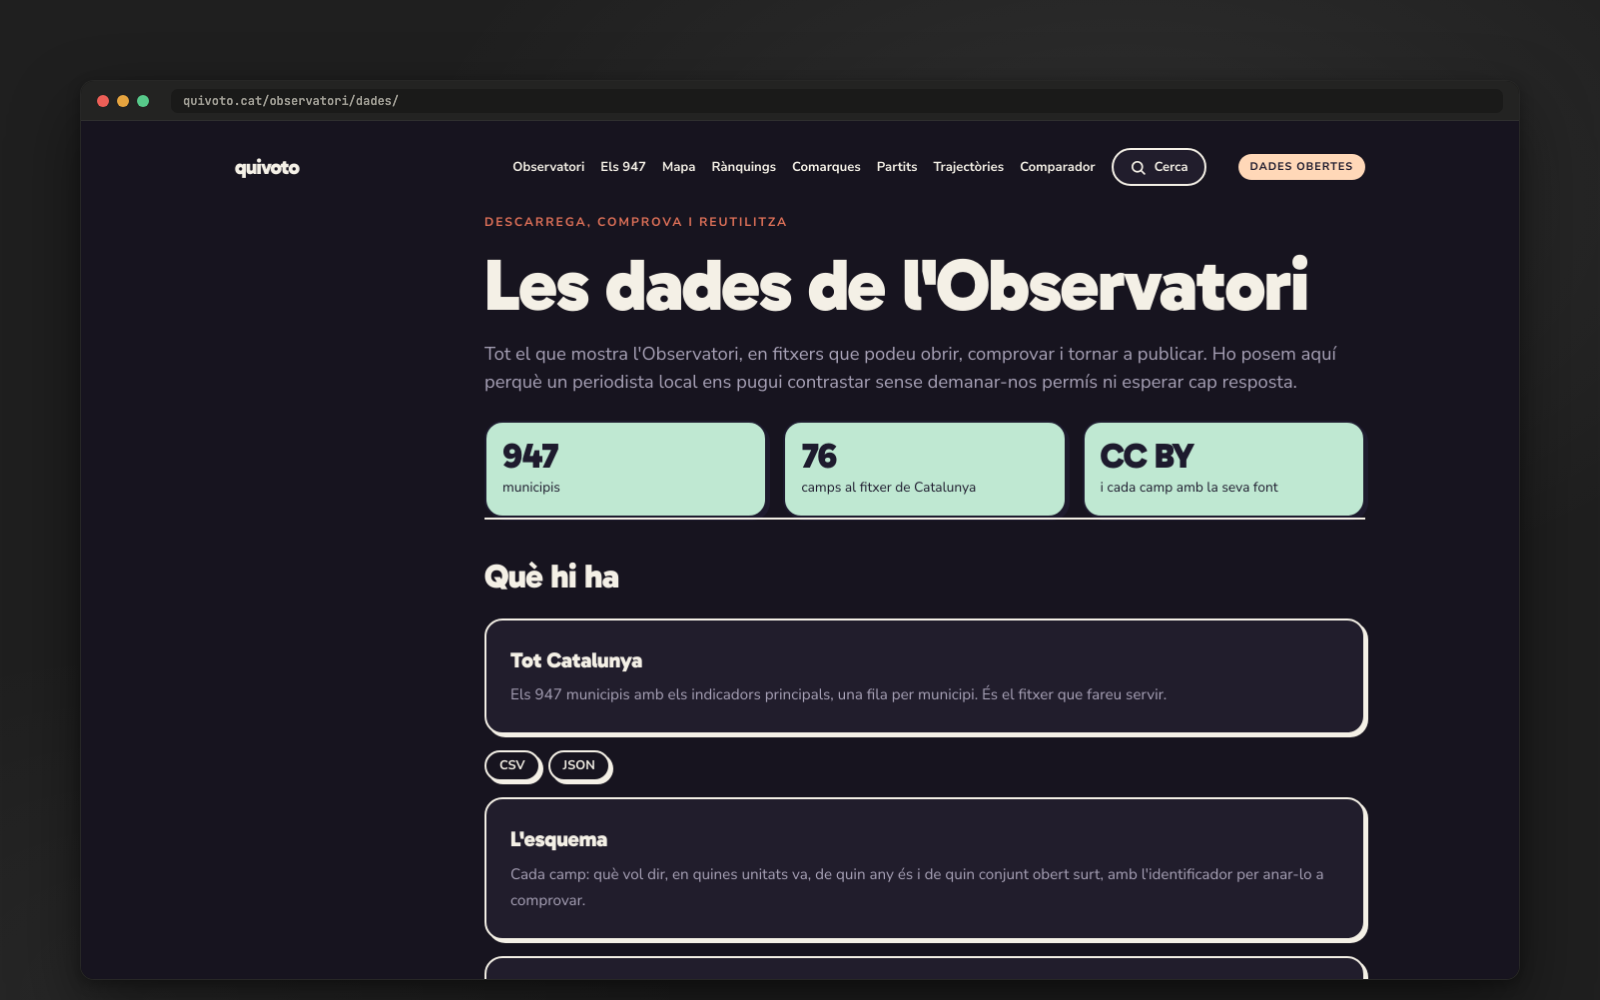
Every number with its source next to it. 39 registered sources, 114 documented fields and 1,894 CSV and JSON files under a CC BY licence. No language model generating political positions: calculations anyone can repeat and check.
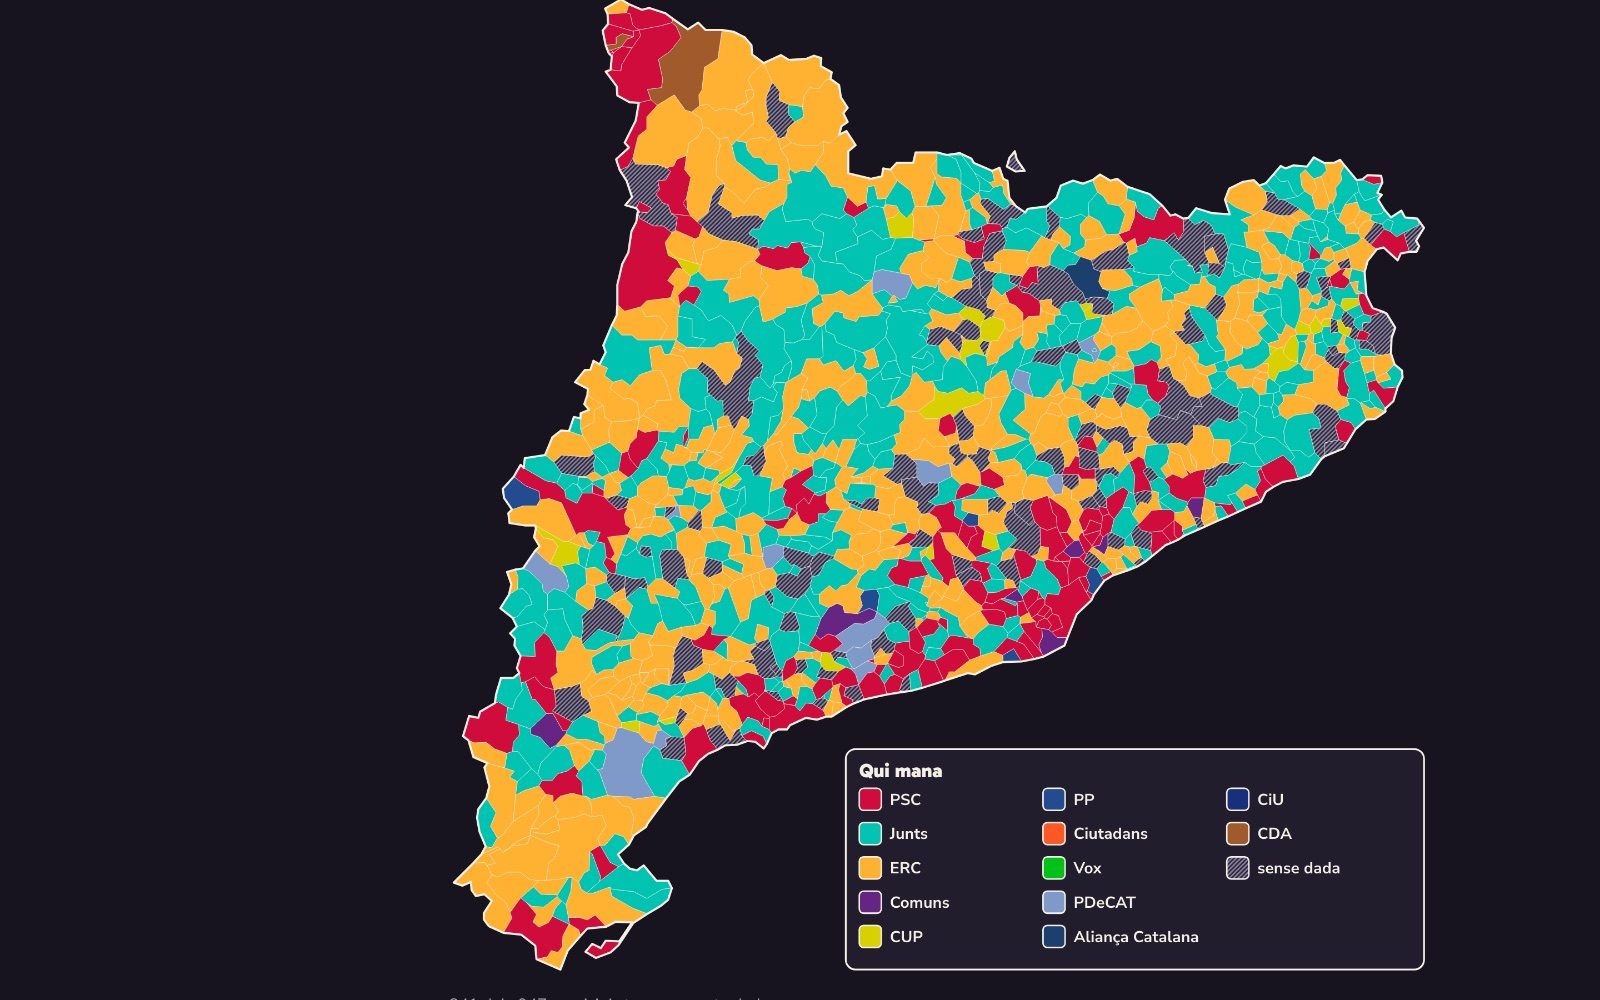
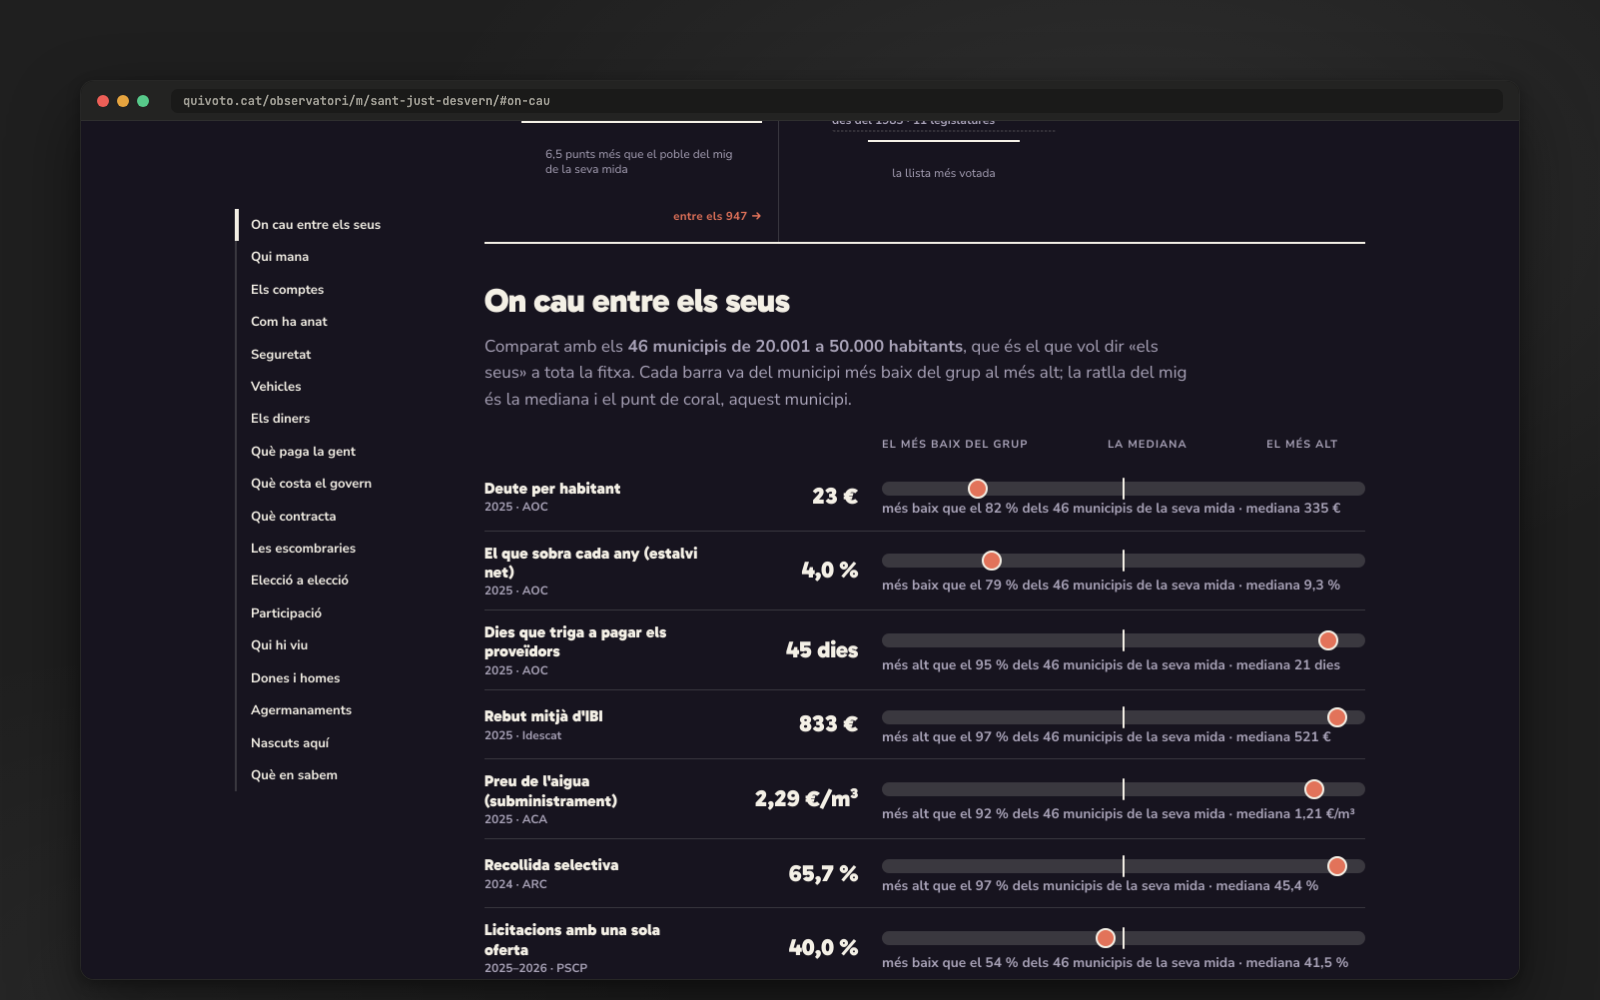
A comparison tool, a map and 43 counties. Up to four municipalities side by side (debt, spending per inhabitant, taxes, turnout, council fragmentation), rankings, and who runs each county.
Answers stay in the browser. The demonstration requires no account and calculates results locally. The website declares Google Analytics for aggregate visit measurement; that measurement is separate from how answers are handled. Status reviewed in September 2026.
From the town to the data.
The challenge was not to manufacture a convincing percentage. It was to show where every comparison comes from, what is known and what is still unknown. The interface treats uncertainty as part of the product: when a figure is missing or a candidacy has not validated its position, it says so with the same visual weight as a result.
The project in numbers
What the data already says
While the compass is on its way, the Observatory already tells stories that never make a headline. In 699 of the 947 municipalities an absolute majority governs; in 62 a coalition deal means the most-voted list is not in charge; in 213 the mayoralty has changed hands since 2023; and 185 councils — the largest being Gironella, with 5,083 inhabitants — have no opposition at all: a single candidacy in the chamber. Six villages do not even have a council in the usual sense: they run as open councils, an assembly of neighbours.
| Fact | Municipalities | % of 947 | |
|---|---|---|---|
| Governed by the most-voted list | 874 | 92.3% | |
| Absolute majority | 699 | 73.8% | |
| No outstanding debt | 439 | 46.4% | |
| Mayor changed since 2023 | 213 | 22.5% | |
| No opposition on the council | 185 | 19.5% | |
| Open lists or open council | 177 | 18.7% |
Source: quivoto Observatory, catalunya.csv file (CC BY open data, downloaded 3 September 2026). Original data from the Government of Catalonia, the Spanish Ministry of Finance and the Catalan Ombudsman. The 62 coalition deals and the 11 municipalities without government data are not counted in the first bar.
Then come the records. Four municipalities had 100% turnout in 2023 — Sant Jaume de Frontanyà, population 25, among them — while Cabanelles stayed at 32.4%. 439 municipalities, almost half, carry no debt; Forès owes €7,718 for each of its 38 residents. Eight councils have been run by the same political force since 1979 — L’Hospitalet and Sant Boi among them — while Portbou and Malla have changed winner ten times in twelve elections. Sitges has the most fragmented council in Catalonia; Mieres the most female (86%). And in 309 municipalities property tax is still calculated on a cadastral valuation older than 1990.
| Indicator | Municipality | Value | Note |
|---|---|---|---|
| 100% turnout in 2023 | Sant Jaume de Frontanyà, Esterri de Cardós, Fulleda and Granyena de les Garrigues | 100% | Four municipalities of 25 to 174 inhabitants. The lowest: Cabanelles, 32.4%. Catalan median: 65.3%. |
| Outstanding debt per inhabitant | Forès | €7,718/inhab. | 38 inhabitants. At the other end, 439 municipalities (46%) carry no debt at all. |
| Open council | Castell de l'Areny, Fígols, Gisclareny, Savallà del Comtat, Senan and la Quar | 6 municipalities | Decisions are taken in a residents' assembly. Another 171 vote through open lists. |
| Councils with no opposition | Gironella (the largest, 5,083 inhab.) | 185 councils | A single candidacy on the council: 19.5% of Catalonia. |
| Same party in the mayoralty since 1979 | L'Hospitalet de Llobregat, Sant Boi de Llobregat, Malgrat de Mar… | 47 years | Eight municipalities. Catalan median: 7 years. Longest-serving individual mayor: Fogars de la Selva, also 47. |
| Most fragmented council | Sitges | 6.78 effective parties | Laakso-Taagepera index. 305 municipalities have 7 councillors; Barcelona has 41. |
| Most volatile councils | Portbou and Malla | 10 changes | Of winning party across 12 elections. |
| Women on the council | Mieres | 86% | Median: 44%. 228 councils with a female majority (of 734 with data) and 6 with none. |
| Urban property tax (IBI) rate | Blanes | 1.23% | Minimum: 0.40% (Alcanó, Almatret, Bassella…). 309 municipalities apply it on a cadastral valuation older than 1990 (Seva: 1984). |
| Highest average rent | Sant Vicenç de Montalt | €1,637/month | Second: Sant Just Desvern, €1,478/month (the studio's home town). |
| Average payment period to suppliers | Margalef | 1,644 days | Median: 15 days. 3.1% exceed the legal 60 days. |
| Most expensive government per inhabitant | Sant Jaume de Frontanyà | €532/inhab. | The arithmetic of 25 inhabitants: the smallest municipality. The largest, Barcelona, has 1,731,649. |
Source: quivoto Observatory, catalunya.csv file (CC BY open data, downloaded 3 September 2026). Original data from the Government of Catalonia, the Spanish Ministry of Finance, the Catalan Ombudsman and Incasòl. Every figure carries its source on the municipality profile.
One last one, close to home: the highest average rent in Catalonia is in Sant Vicenç de Montalt (€1,637 a month) and the second highest in Sant Just Desvern (€1,478), the town where this studio is based. None of this is opinion: it is minutes, results and audited accounts, each with its source next to it, and anyone can repeat the calculation with the downloadable files.
How it went
Gallery · the project in pictures (click to enlarge)
Read, compare, check.
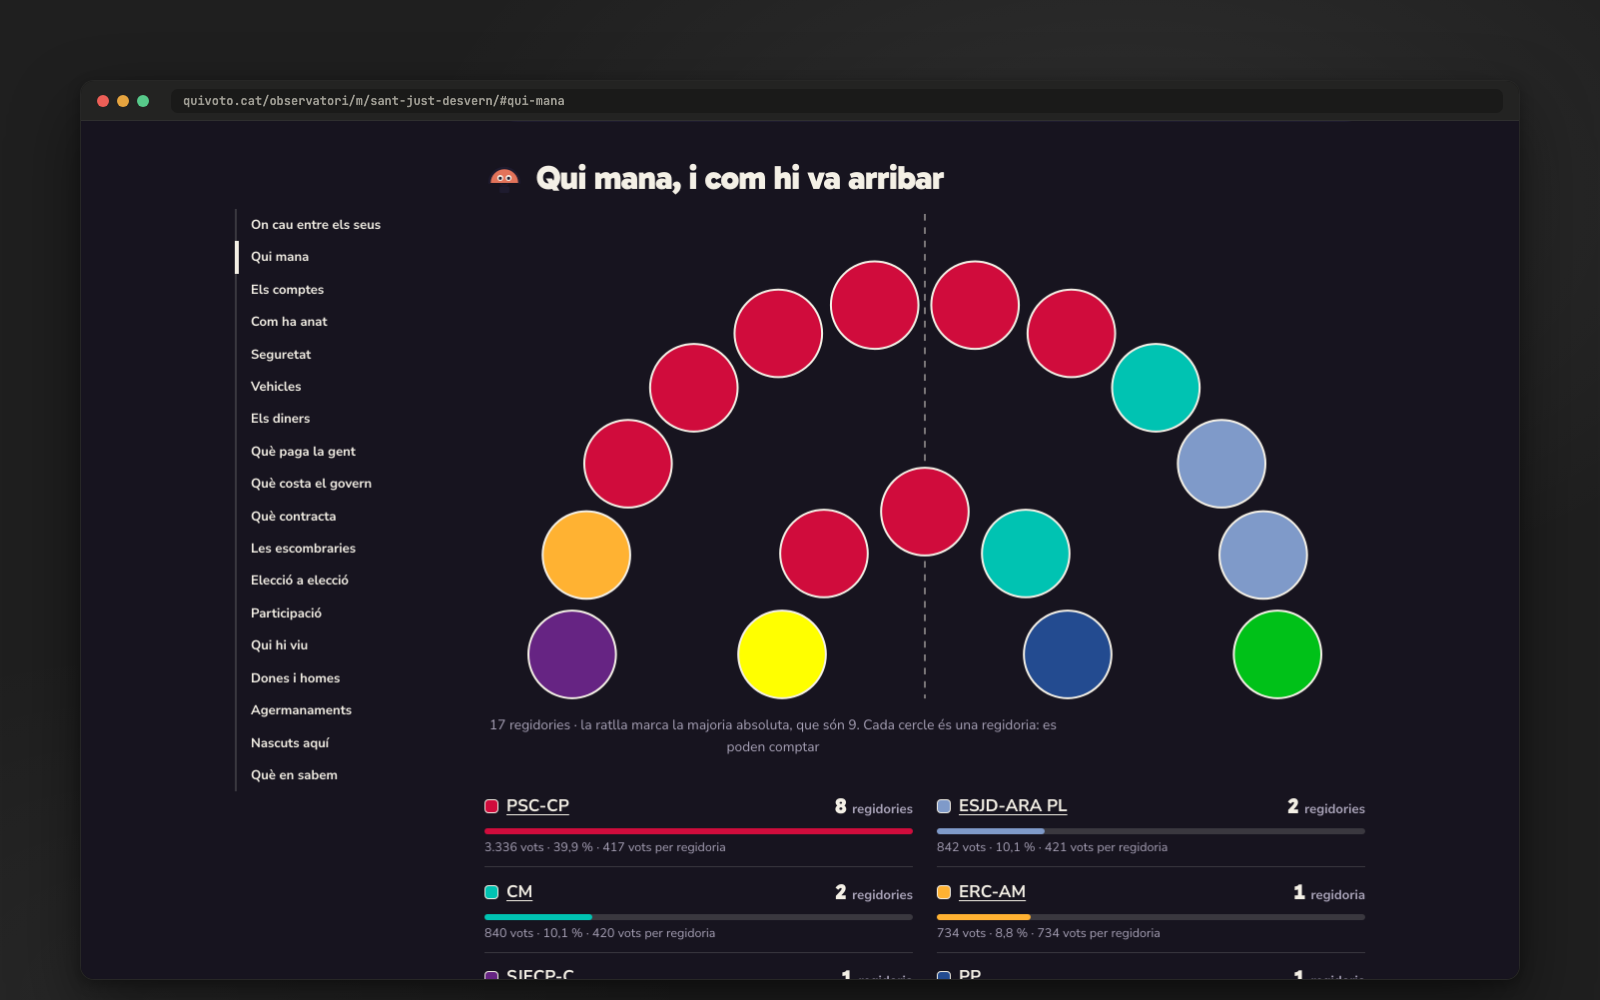
Actual navigation through the Observatory in September 2026: locate a municipality, open its profile and compare the data. The Observatory is available; the full electoral compass is planned for 2027.
- Map: find the municipality.
- Profile: read each figure in context.
- Comparison: put the same measures side by side.
More images from the project 8 ↗
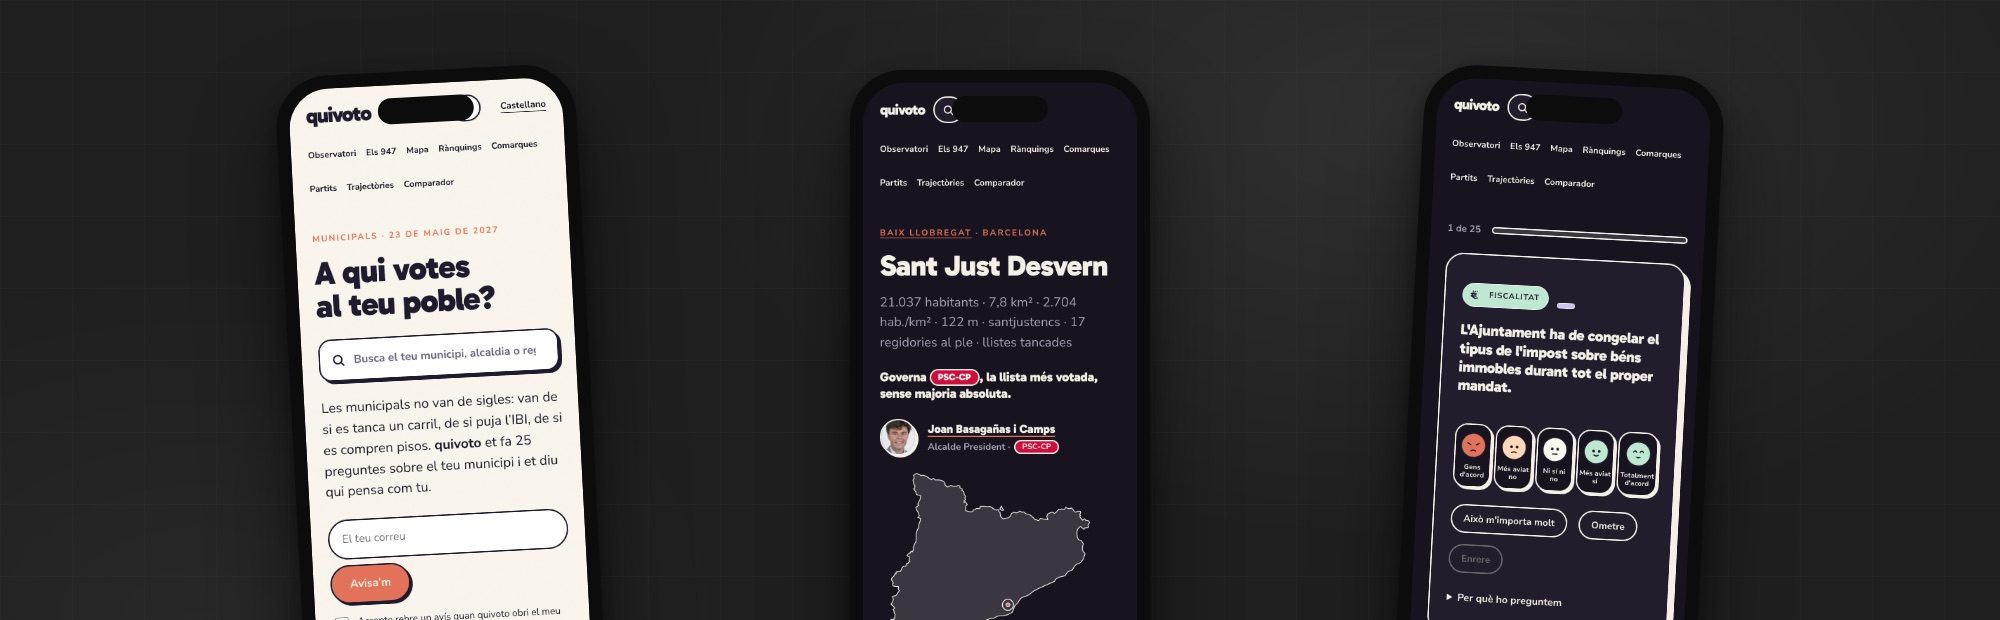
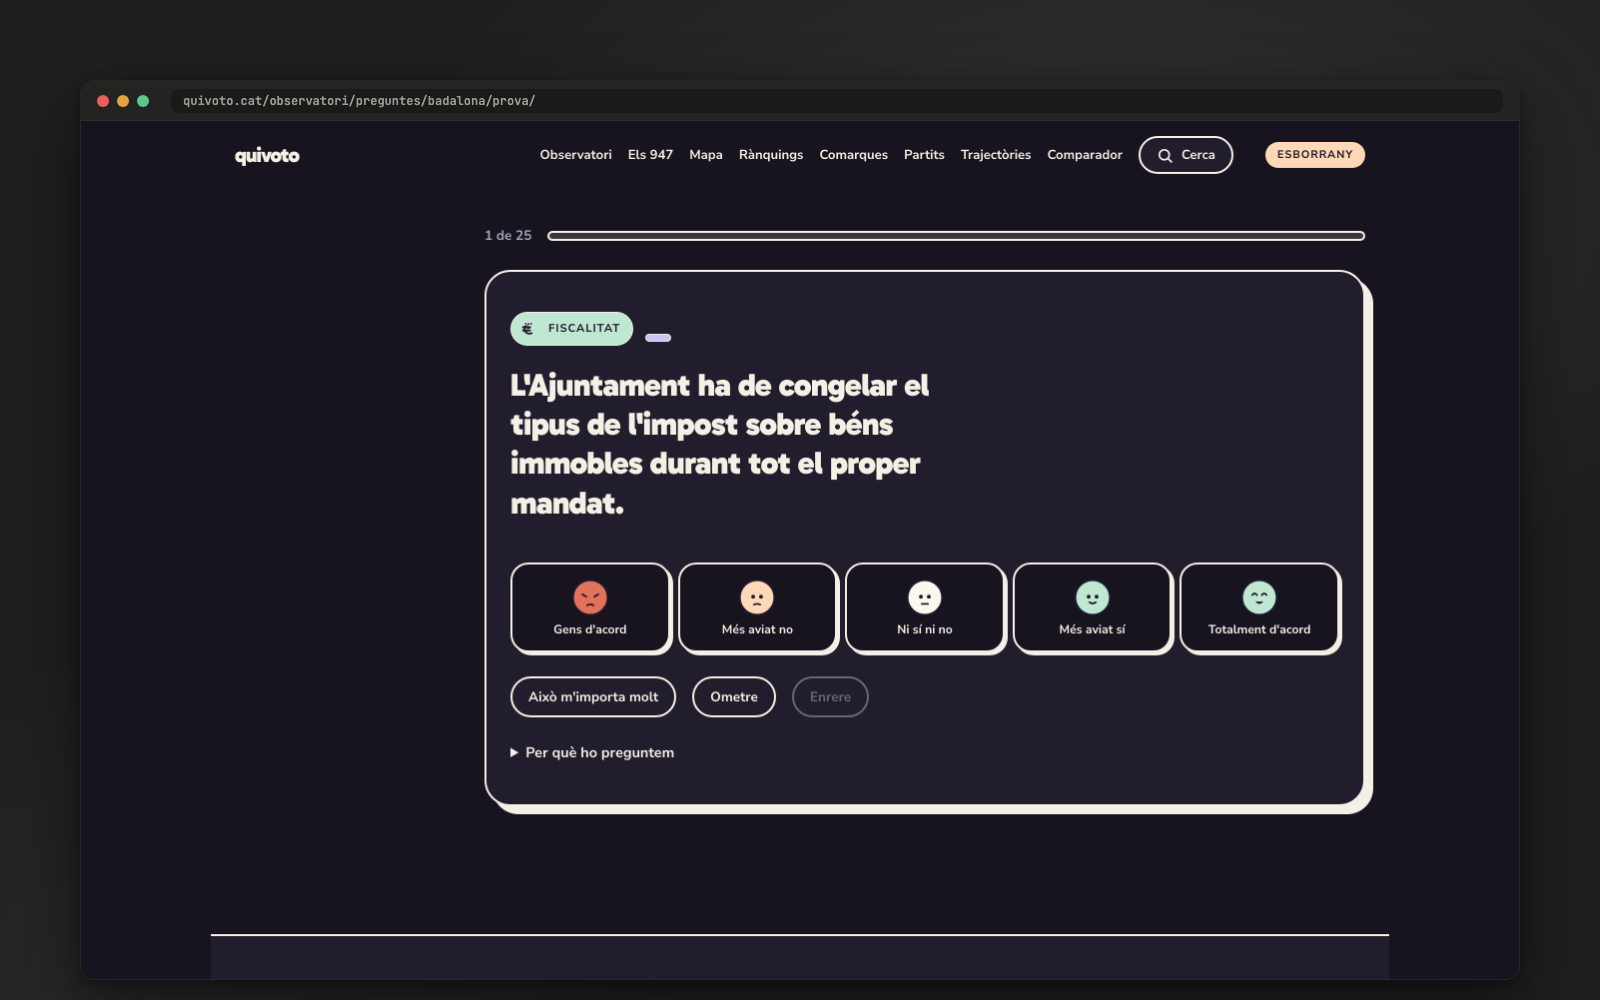
"Municipal elections are not about party labels: they are about whether a lane gets closed, whether property tax goes up, whether the council buys housing."quivoto.cat
Credits · the people behind it
Want a result like this for your project?
We tell the story on the blog
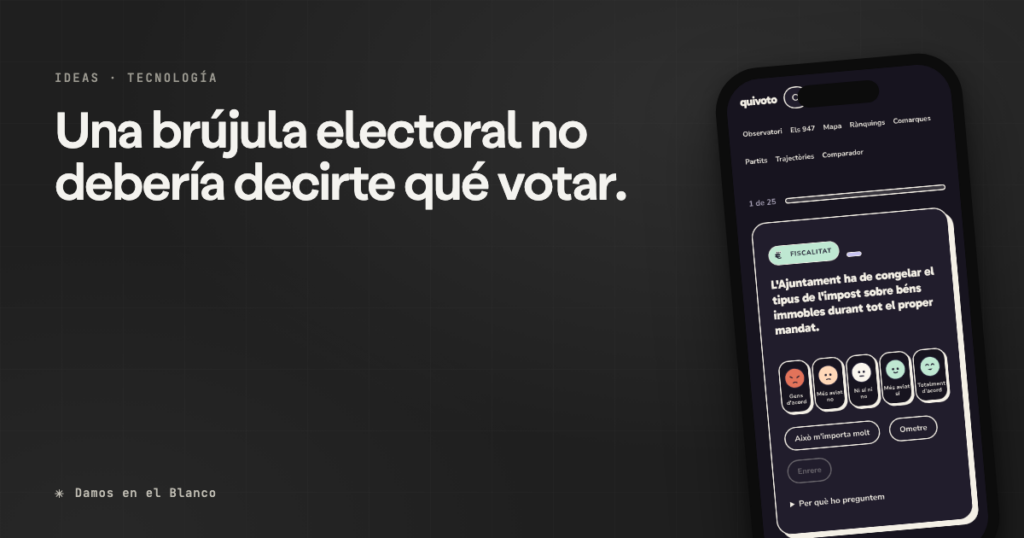 A voting compass should not tell you how to vote
A percentage is not an answer: it is a hidden decision. This is how we built quivoto — 947 municipalities, 39 sources, zero cookies — and what its… Read the article →
A voting compass should not tell you how to vote
A percentage is not an answer: it is a hidden decision. This is how we built quivoto — 947 municipalities, 39 sources, zero cookies — and what its… Read the article →
More from this sector
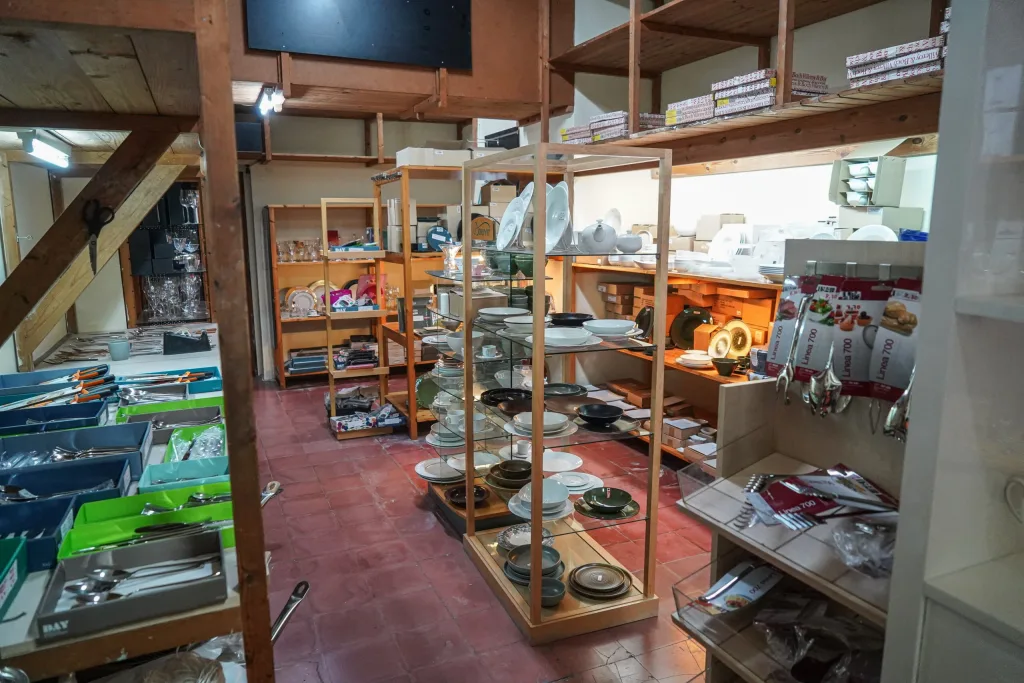
Cristall i Porcellana
A digital catalogue for composing the table piece by piece
View case study →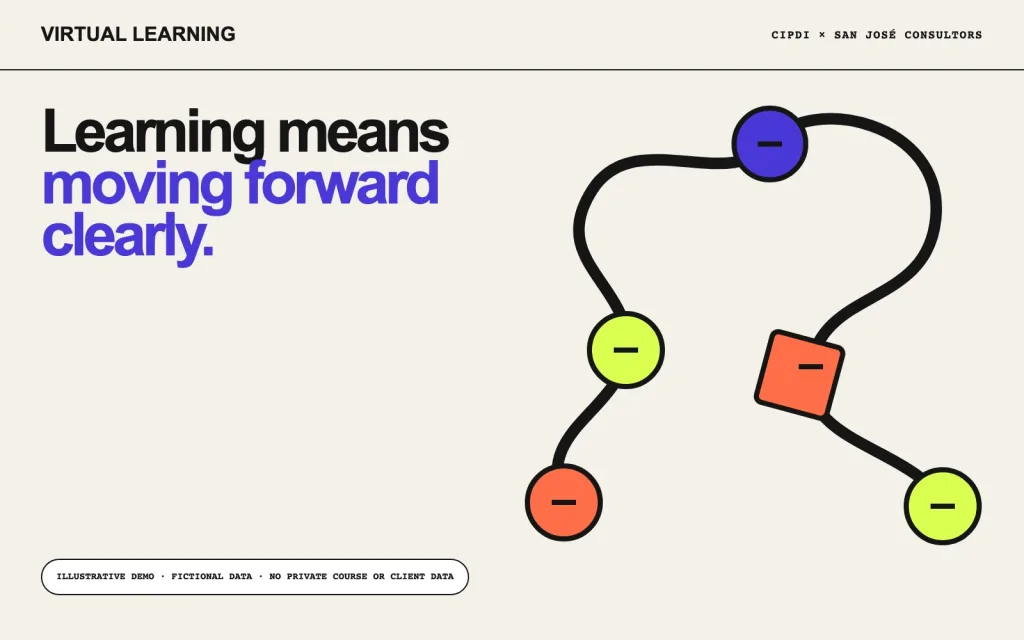
CIPDI + San José Consultors
An adaptable learning architecture for two professional contexts
View case study →
Viver Isart
A century-old nursery shaped into a living digital experience
View case study →